Getting started
System requirements
Minimum requirements:
- OS: Windows 8 (64 bit)
- Processor: Intel i5 Quad core
- 4GB RAM
- Video card capable of running OpenGL 3.3
- Storage: 10GB of free hard drive space available
Recommended:
- OS: Windows 10 (64 bit)
- Processor: Intel i7 Quad core
- 16GB RAM
- Video card capable of running OpenGL 4.0
- Storage: 30GB of free SSD space available
Supported programming languages and platforms
Superluminal is capable of displaying performance data for the C++, C#, D and Rust programming languages, on the Windows, Xbox One®, Xbox Series X®, PlayStation®4 and PlayStation®5 platforms.
- To view PlayStation 4 documentation, click here.
- To view PlayStation 5 documentation, click here.
- To view Xbox One or Xbox Series X documentation, click here.
Command-line tools
A command-line version of Superluminal can be found in the installation directory and is called SuperluminalCmd.exe. The command-line version of Superluminal is built to easily make captures, either locally, or on remote machines. It does not require a Superluminal license and can be easily deployed to other machines. The help for the command-line version of Superluminal can be found here.
Installation
The installer for Superluminal can be downloaded from the main Superluminal site.
Installation Options
The installer will allow you to choose for which users Superluminal should be installed: for just the current user, or for all users on the machine:
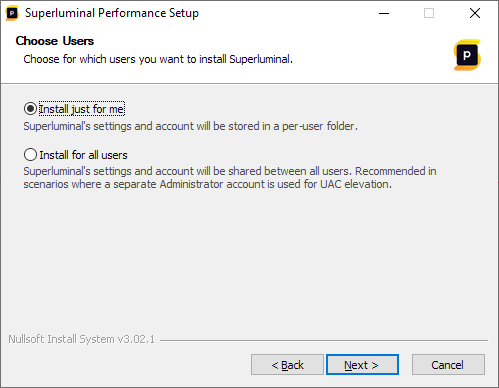
The default, and recommended, option is to install Superluminal for the current user only. The difference between both options is as follows.
Install just for me
This option is the default, and recommended for most scenarios. When this option is selected, settings for Superluminal will be stored in a per-user folder. On a machine with multiple users, this option allows each user to have their own settings and use their own account to activate Superluminal. This option should be used in the following scenarios:
- When there is only one user on the machine
- When you have multiple users on a machine, but each user should be able to specify their own settings and be able to activate Superluminal with their own account
Install for all users
When this option is selected, settings for Superluminal will be stored in a per-machine folder and shared between all users on the machine. On a machine with multiple users, this option will result in each user on the machine sharing both settings and account data with all other users on the system. This option should be used in the following scenarios:
- When you have multiple users on a machine that should all share settings and each user should use the same account to activate Superluminal
- When the regular user does not have Administrator rights, and a separate Administrator account is used for UAC elevation
Installer Command-line Options
The installer supports a number of command-line options. They are as follows
- /S: Silently install without showing UI. Typically used for scenarios where Superluminal is automatically installed.
- /D=C:\Superluminal\Install\Dir: Install Superluminal to the specified path.
- /allusers: Install Superluminal for all users (see Installation Options for more information). When this option is not specified, the installer defaults to installing Superluminal for the current user only.
Licensing and Activation
When the application is launched for the first time, you will need to activate it first.
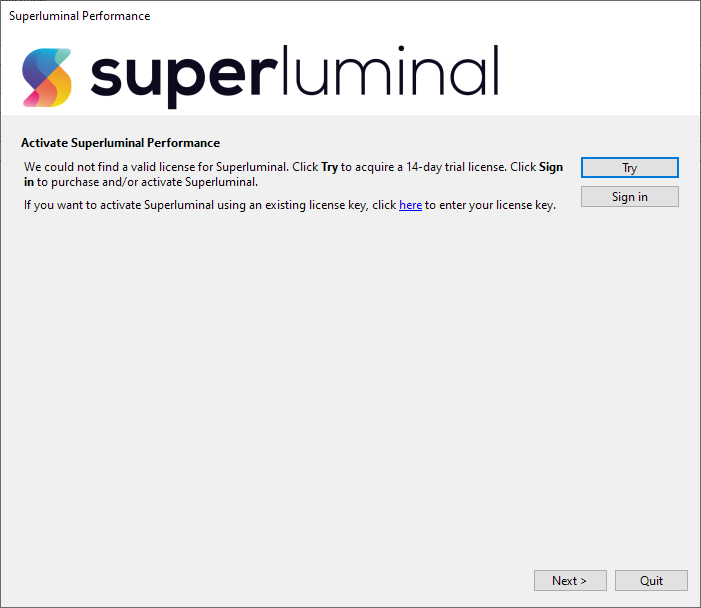
To start the trial period, press the ‘Try’ button. The trial is fully functional and lasts for 14 days and requires no sign up. If you want to purchase Superluminal, or activate an already purchased license, please select one of the options below:
- If you haven't purchased a Superluminal license before, see Purchasing a new license.
- If you already created an account through the website and want to activate it, see Activating an existing account.
- If you have previously purchased a license key through the old licensing system and want to activate it, see Activating a license key.
Purchasing a new license
If you're a new customer and you'd like to purchase Superluminal, you will need to create an account before you can activate it. This can be done either by pressing 'Sign Up' on our Pricing Page, or by pressing 'Sign in' directly through Superluminal. This will bring you to the Sign In page:
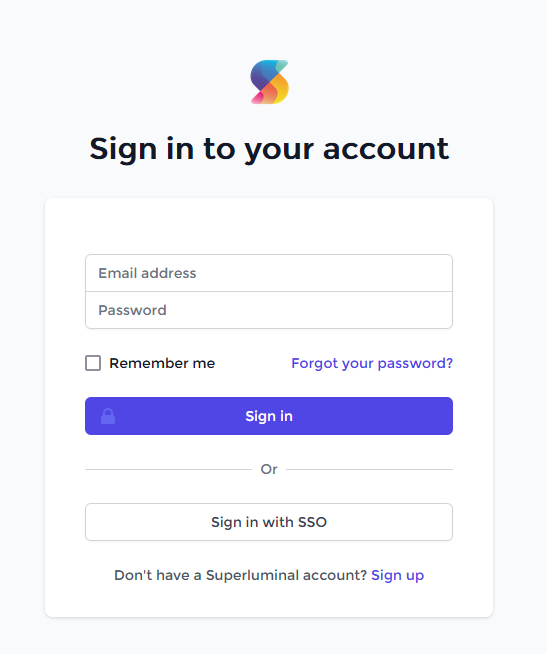
If you already have an account, you can enter your credentials here to log in. If you don't have an account yet, press 'Sign Up'
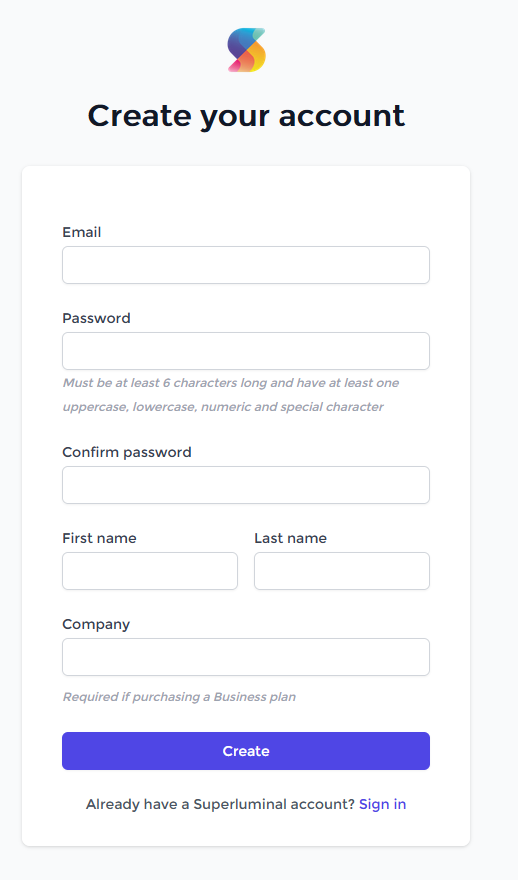
After you entered your credentials, you can click Create. You will now first need to confirm your email account:

An email should arrive shortly. When you click the 'Confirm Account' button in your email, a browser will be opened where you can select a Plan:

After selecting a Plan, you can purchase it. After the purchase has completed, your account is fully set up. In case you came here through the activation window in Superluminal, Superluminal will automatically be activated:
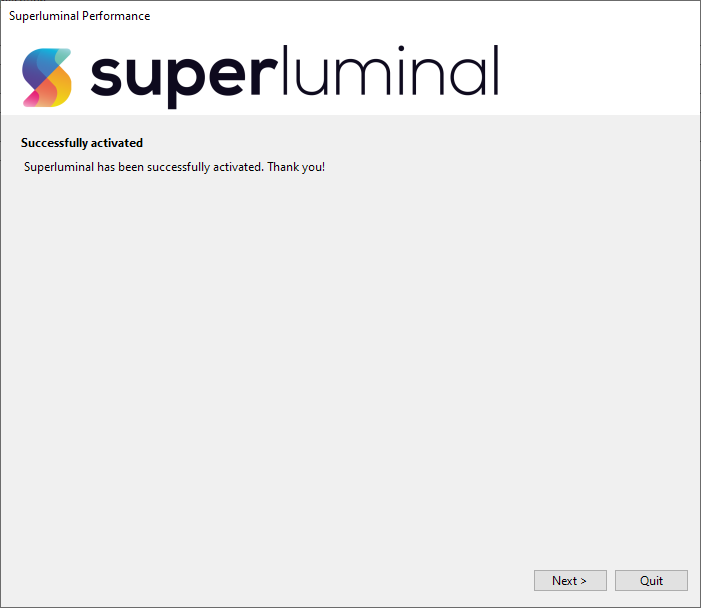
In case you did not log in through Superluminal, but came here through the pricing page instead, you will need to activate Superluminal using your newly created account. In that case, please proceed to Activating an existing account.
To further manage your account, see Managing your account.
Activating an existing account
If you already created an account and purchased Superluminal, you will need to activate it. Upon launching Superluminal, the following screen will pop up if Superluminal was not activated yet:

To activate your existing account, press 'Sign in'. Superluminal will open up a browsing where you can log into your account:

After you entered your credentials and have logged in, Superluminal will be automatically activated:

There are a few cases in which Superluminal was already activated, and therefore, the activation window did not pop up automatically. To activate your new account, you first need to sign out of your previous account. Let's go over the different scenarios to bring up the activation dialog.
1) If Superluminal was activated through the old license-key based system, you can go to Tools/Licensing. Note that this menu item will not be available if there was no successfully activated license key. Pressing the menu item will bring up the following window:
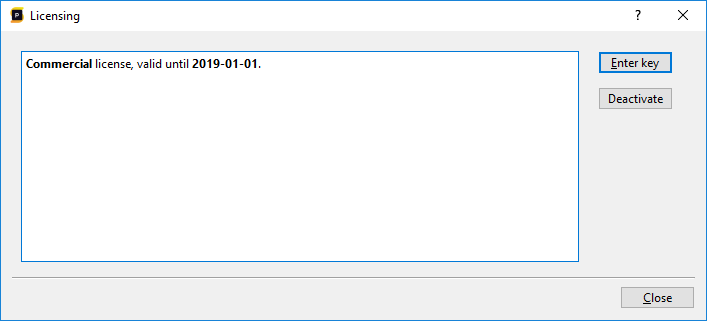
If you press 'Deactivate', the license key will be deactivated, and the window to activate your new account will be brought up immediately after deactivation. You can proceed the activation process from there.
2) In case the Trial mode is still active, and you'd like to activate your account, you can click on the 'Trial' UI in the top-right corner:
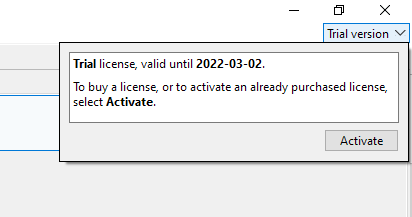
By pressing Activate, the activation window will be opened, where you can continue to activate your account.
3) In case you already activated Superluminal using a different account, you should see the email address that you used to activated Superluminal in the top-right corner of the screen. Click it to show the following window:
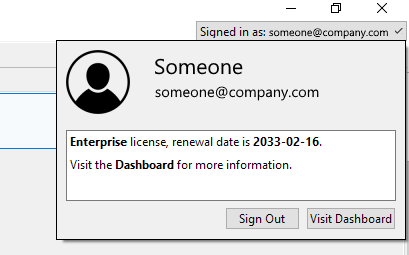
To activate another account, press 'Sign Out'. This will sign you out of the portal, and deactivate Superluminal. The activation window will be brought up immediately after sign out, allowing you to sign into a different account.
To further manage your account, see Managing your account.
Activating a license key
Before we introduced the account based system where your license can be managed through the Dashboard, license keys were used to activate Superluminal. These license keys are still valid and can still be used to activate Superluminal. Upon launching Superluminal, the following screen will pop up if Superluminal was not activated yet:

To activate your license key, press the link shown in the text to enter your license key.
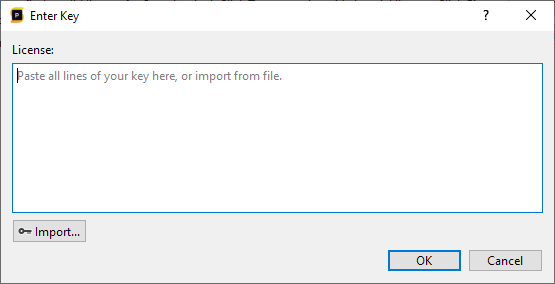
Here you can either paste the license key text directly, or press 'Import' to browse to the license file. After the initial activation has been completed, it is possible to manage your license by selecting Tools/Licensing from the main menu.

Here you can see your current license key and you have the option to enter a new license key. In cases where you want to migrate your license to another machine, you can manually deactivate your license on your machine so that the key can be activated on another machine. After deactivation, the application will no longer be usable on the machine it was deactivated on, until a new key is entered.
In case the activation window did not pop up because the Trial mode is still active, and you'd like to activate your license key, you can click on the 'Trial' UI in the top-right corner:

By pressing Activate, the activation window will be opened, where you can continue activate your license key.
Managing your account
The licensing Dashboard allows you to manage your account. This includes managing your Activations, Billing, Users, Platforms, and setting up Single-Sign On. All of this is accessible by logging into the Portal directly, or by clicking your activated account in Superluminal in the top-right corner of the screen, and then selecting 'Visit Dashboard'

Documentation on how to use the Dashboard can be found on the Documentation page in the Dashboard itself.
Sampling and Instrumentation
Sampling and instrumentation each have their advantages and disadvantages. Advantages of sampling:
- You can hit the ground running without making code modifications
- You can spot problems that you did not anticipate. With instrumentation, you need to insert tags in places that you suspect could be problematic
- Sampling can give you kernel-level stacks or stacks from libraries that you do not have control over
However, instrumentation has advantanges over sampling:
- Instrumentation is more precise. Despite the high sampling frequency, absolute precision is better achieved with instrumentation.
- Instrumentation can provide context. What file were you loading? What frame are you in? What state is your code currently in?
Unlike traditional profilers, the Superluminal profiler doesn't force you to make a tradeoff between sampling and instrumentation. Out of the box, the Superluminal profiler is a sampling profiler that runs at 8 kHz.
You can begin simply by starting a profiling session and incrementally add instrumentation events by using the Performance API as you discover where you want to place these events.
The sampling data is then combined with the instrumentation events you add, giving you the best of both worlds. See the Instrumentation Timings View and Threads View sections for more information.
Starting a new profiling session
Before making your first capture, please be aware that in order to get symbol information, the application you're profiling must be built with certain settings. See Compiler & Linker settings for more information.
To start a new profiling session, enter the New Session page. If the page is not already visible, you can click File/New Session in the menu bar to go the New Session page.
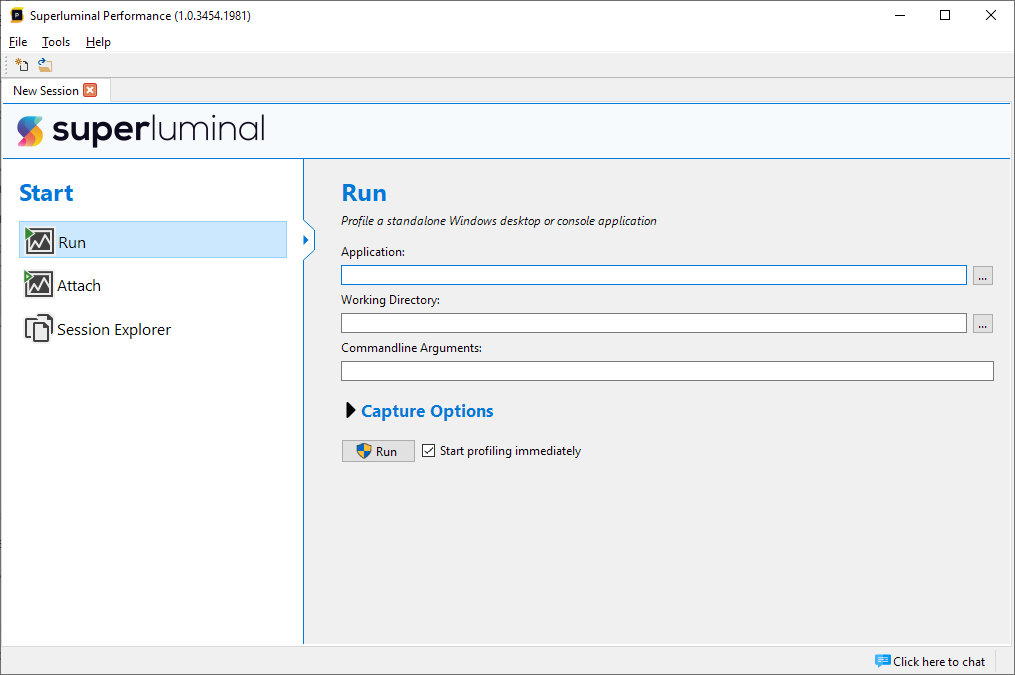
Here you can choose to launch a new process through 'Run', to attach to an already running process through 'Attach', or to go to the Session Explorer. The Session Explorer will show all your stored profiling sessions, allowing you to quickly find previously recorded sessions, to annotate and manage them. For more detailed information about the Session Explorer, see Managing Sessions & runs.
If PlayStation and/or Xbox profiling is enabled for your license, a platform subselection menu will appear for both Run and Attach:
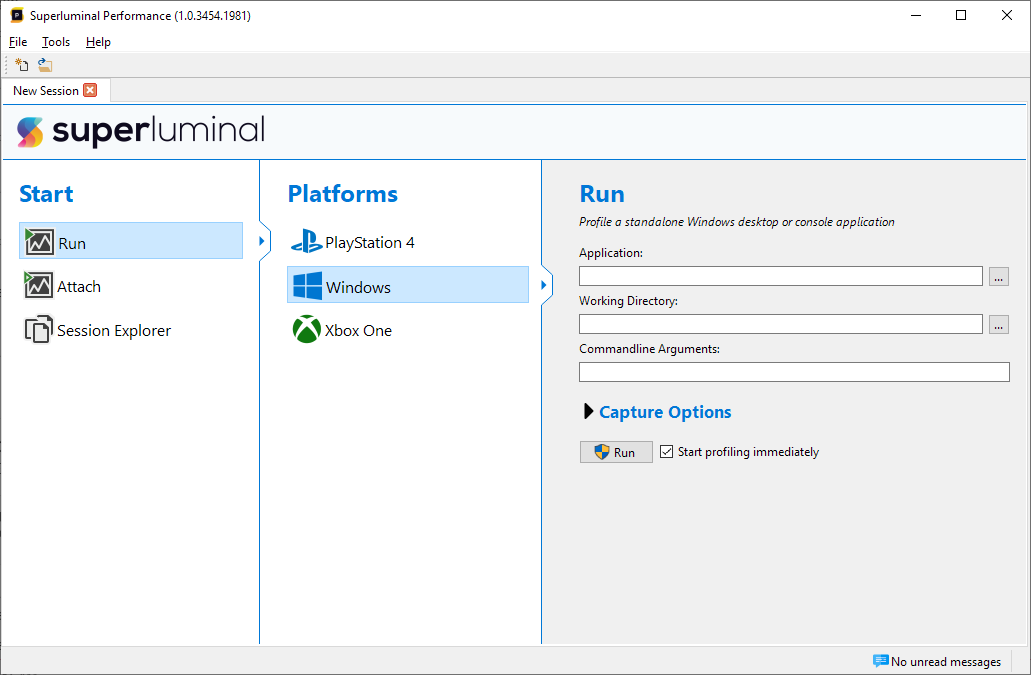
If you're a registered PlayStation and/or Xbox developer, and you wish to gain access to the Superluminal Xbox and PlayStation plugins, please contact us and we will send you instructions how to confirm your developer status. The plugins will then be installed automatically through the auto-updater, and this submenu will appear for you as well.
Once we've selected either Run or Attach from the menu, we can select how to profile our application. This interface depends on the platform that you have selected. For instance, console platforms allow you to choose a devkit to launch your application on. Please refer to the documentation for non-Windows platforms for more details. On Windows, we can just browse to an application that we want to run, along with an optional working directory and command-line arguments. To start measuring right from the beginning of the application, check ‘Start profiling immediately’. If you prefer to launch the application first, and then select a specific time to start profiling, uncheck this box. Click ‘Run’ to launch the target application.
Note: a popup will appear asking whether the ProfilerCollectionService is allowed to run. This is the Superluminal service that will collect profiling data. Click ‘Yes’ to continue. If you chose to profile right from the start, the following screen will appear:
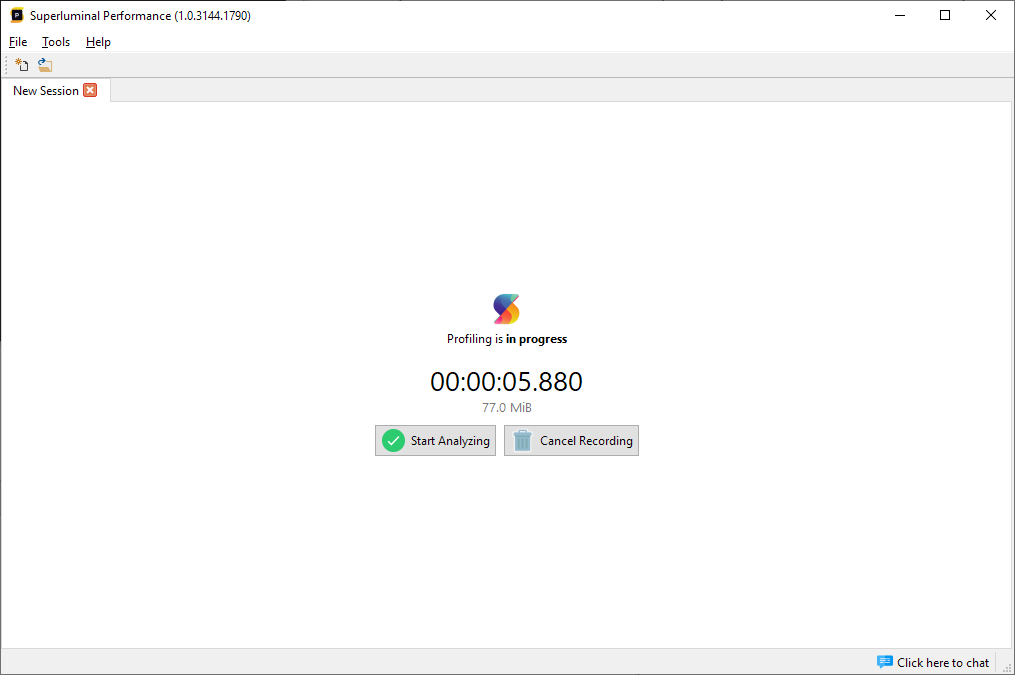
At any time during capturing, you can either rename your session, or type in any comments about the capture you're making in the box at the bottom of the screen. The annotations will be visible in the Session Explorer, making it very easy to organize all the different captures.
As soon as the timer is running, performance data of the target application is being captured. Press 'Start analyzing' to end the capture and start loading it. Press 'Cancel profiling' to return to the New Session page.
In case you decided not to start profiling from the start, the recording screen will be slightly different and look like this:

Here you can see that the timer is not running yet, which means the capture has not started yet, although the target application is already running. Click 'Start recording' to start capturing performance statistics, or click 'Cancel recording' to return to the New Session page.
Once a capture is stopped, it will first be written to disk, after which it will be loaded.
When this is run for the first time, symbols need to be downloaded and converted for use by Superluminal. Depending on the internet speed and the amount of symbols required, this may take some time. After they are downloaded and converted, a local cache will make sure that this only needs to happen once. For more information on configuring symbol resolve settings, please see Symbol Resolving.
Quick overview of the UI
The User Interface is divided into four major UI components:
- Function Statistics
- Threads view
- Callgraph, Function List and Thread Interaction views
- Source & Disassembly
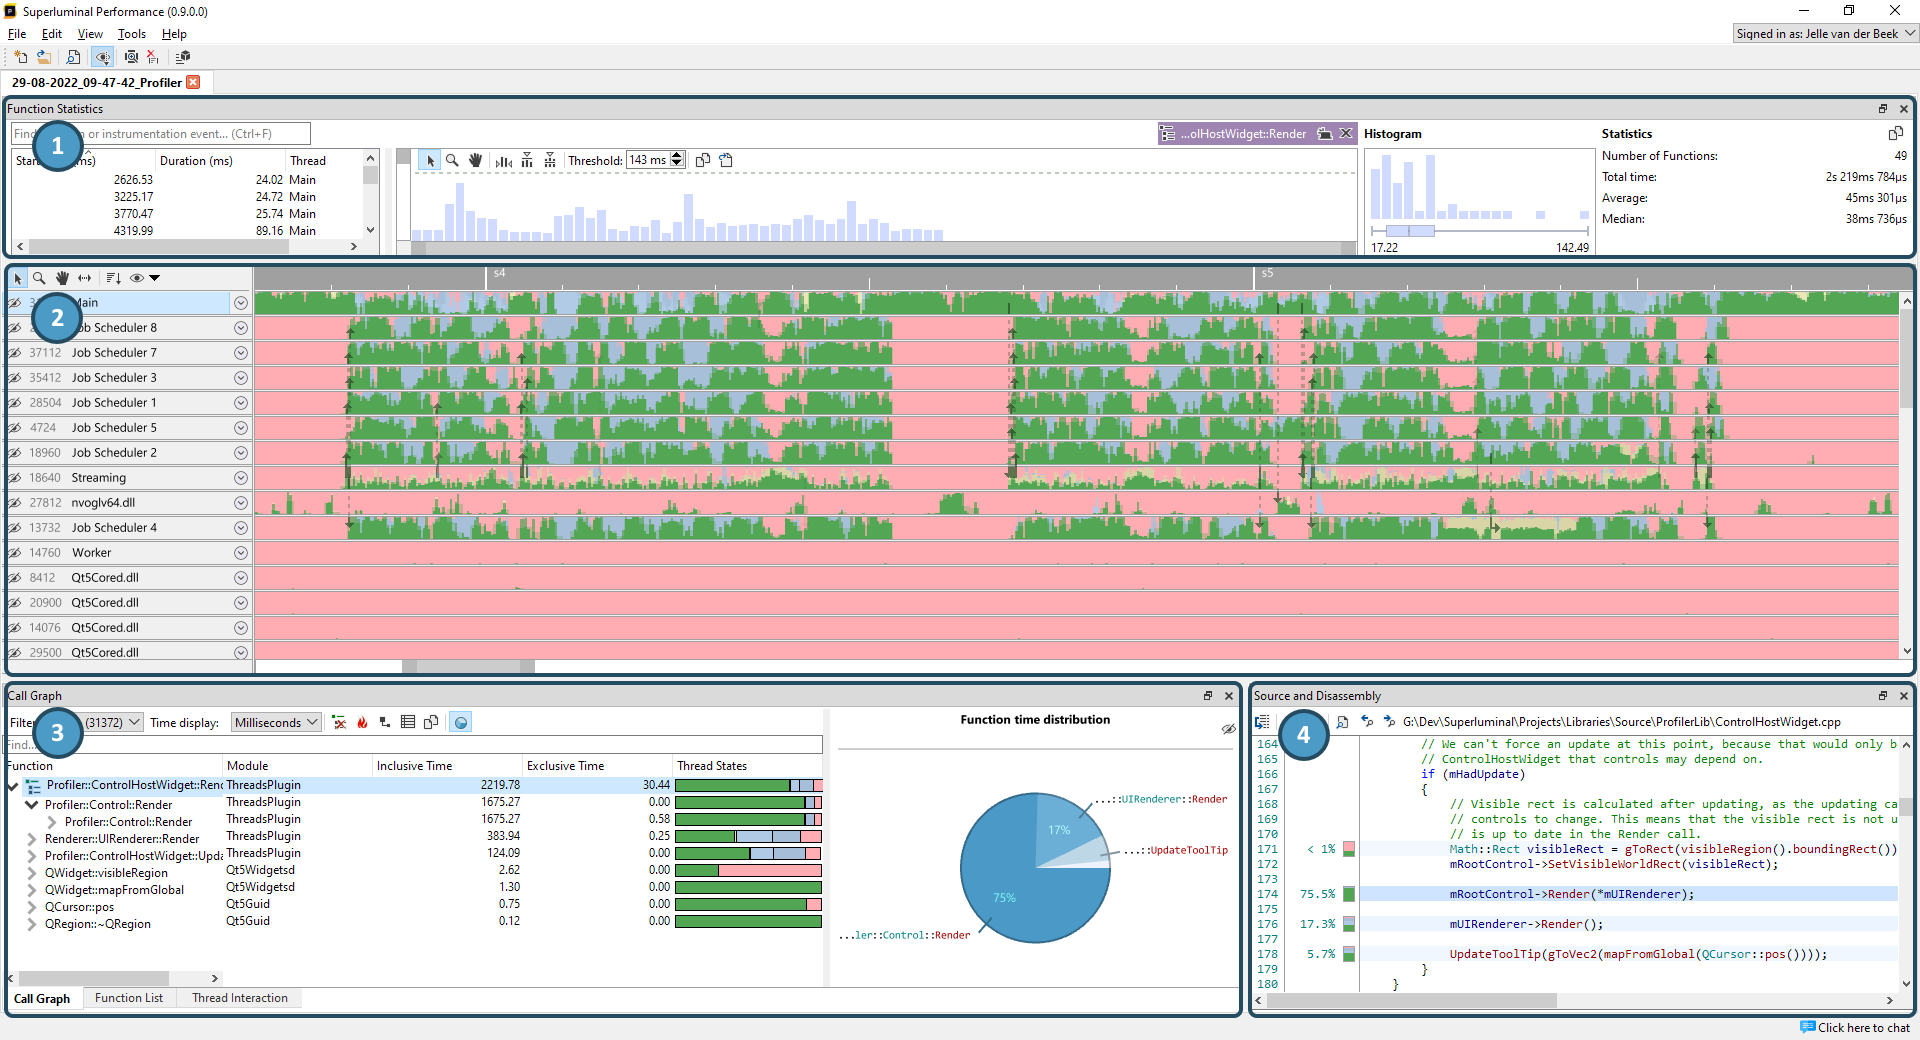
- The Function Statistics view can be used to Find functions or instrumentation events. It will display all the function instances, along with statistical information such as a histogram and boxplot. This view can be populated from almost any view, making it a powerful way to inspect functions.
- The Threads view displays a full recording of your threads on a timeline. At the top of each thread, an overview of the thread's activity is displayed. Each thread can be expanded to view the full recording of your thread. This view is incredibly powerful because it gives you a wealth of context around your code.
- The CallGraph view is a traditional CallGraph, showing you a hierarchical breakdown of functions. The Function list shows a flat list of functions. When clicking on a function, you can see what other functions it is calling, and what it is being called by. This is also known as a 'butterfly' view.
- The Source & Disassembly view responds to the selection in the CallGraph or Function List and displays per-line and per-instruction level timings.
A powerful feature of Superluminal is how views respond to each other, and how they can all be instantly filtered to specific sections. This is best explained by example:
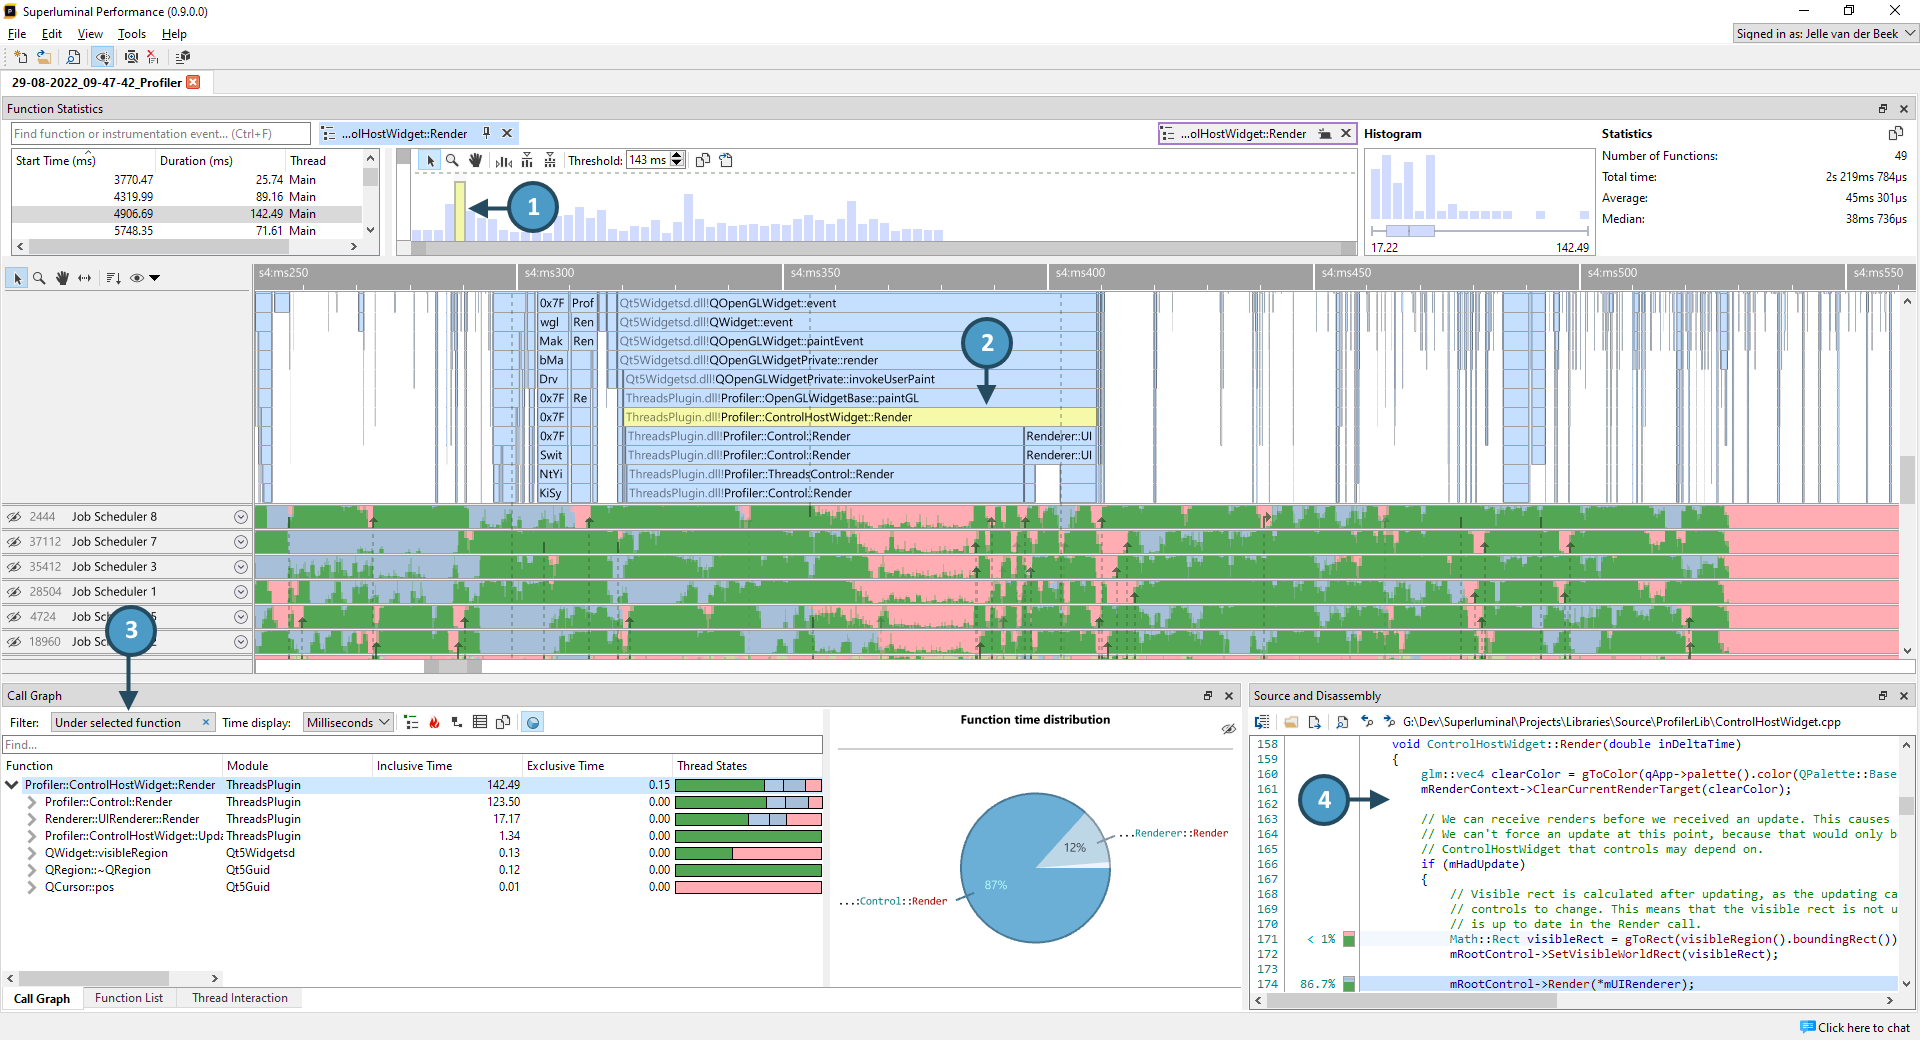
- We clicked on a function in the Function Statistics view that was rather slow
- In the Threads view, that function is selected and highlighted
- The Callgraph and Function List views filter to the selected function only, allowing you to inspect just that particular piece of code
- The Source code view reflects only the timings for this filter, allowing you to inspect the area you are interested in
The same principle applies to time range selections:

- We created a time range selection in the Threads view
- The The Callgraph and Function List filter to the time range selection. The filter can be adjusted further to filter to specific threads
- The Source code view reflects only the timings for this time range, allowing you to inspect the area you are interested in
If any searches are performed while a time range selection was active, they are performed within the selected time range as well.
Working with Sessions
Navigating the UI
Both the Instrumentation Timings view and the Threads view are views that can be panned and zoomed. Being able to navigate them well is important, so there are multiple ways to control these views.
Toolbar buttons
The toolbar buttons on the left side of the graph allow for quick access of the various navigation modes. Clicking them will switch navigation modes. To use the selected mode, click and drag the graph to pan or zoom. To return to regular select mode, click the select toolbar button.

Navigation scrollbar
The navigation scrollbar underneath the graphs will let you both pan en zoom the graph. The center section of the scrollbar pans the graph, while the outer buttons control the zoom level. Click and drag them to zoom and pan.

Input bindings
Panning and zooming can also be controlled by using the configured input bindings from the settings dialog. This is the quickest way of navigating through the views. To view or reconfigure the input bindings or to modify the sensitivity, select Tools/Settings in the menu, and then select the 'Controls' tab.
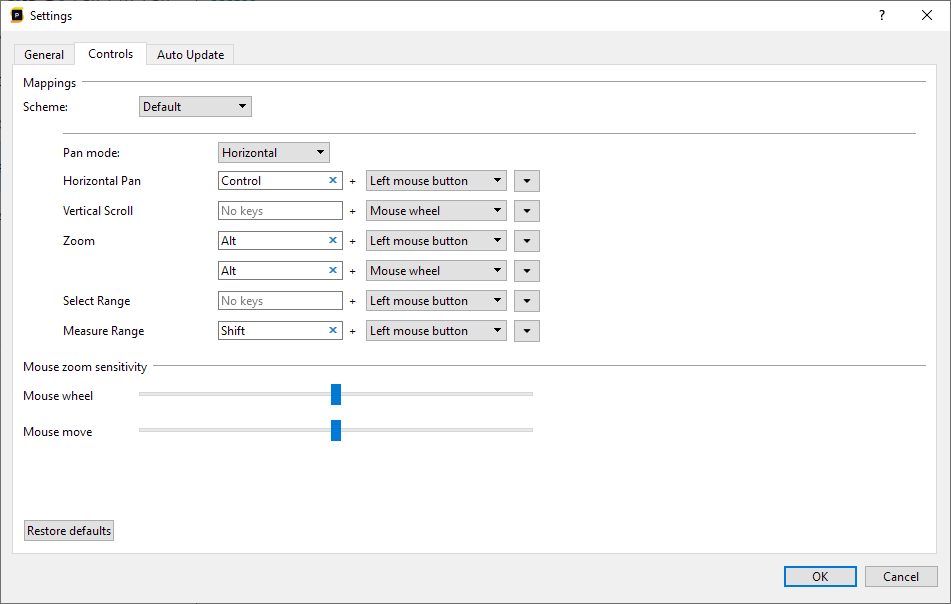
In this dialog you can select a number of schemes that are used in other profilers. Selecting a preset will set the bindings to the bindings that are used in these programs.
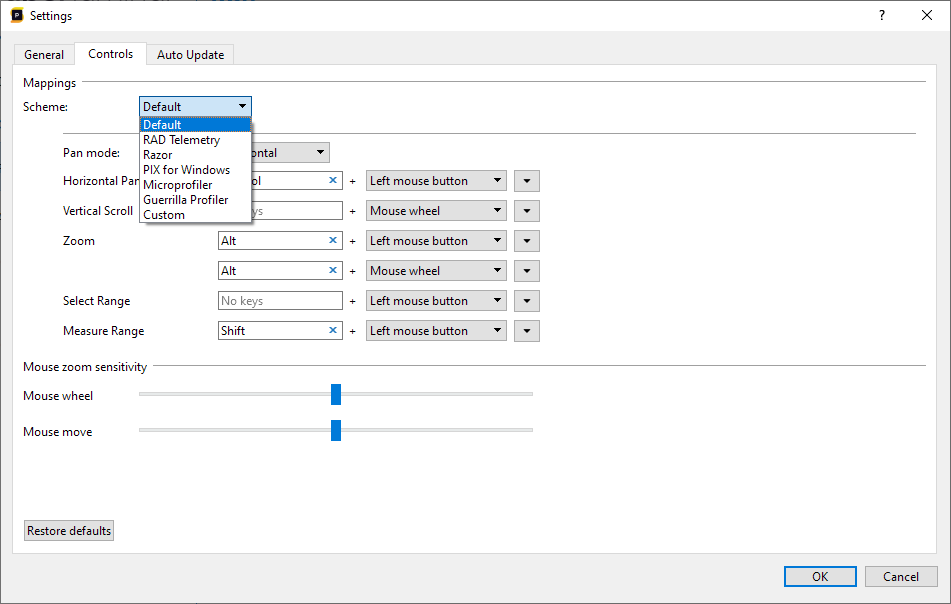
Alternatively, you can modify the bindings manually. Any binding can be configured to have no key at all, to have a single key or to have multiple simultaneous keys. To add keys to a binding, select the key box for the appropriate action and press the key to add. Press backspace to remove keys or escape to cancel and return back to the previous setting. If you want to quickly remove all key bindings, press the small 'x' button.
It is also possible to add multiple bindings for a single action by pressing the down arrow on the right side of the action.
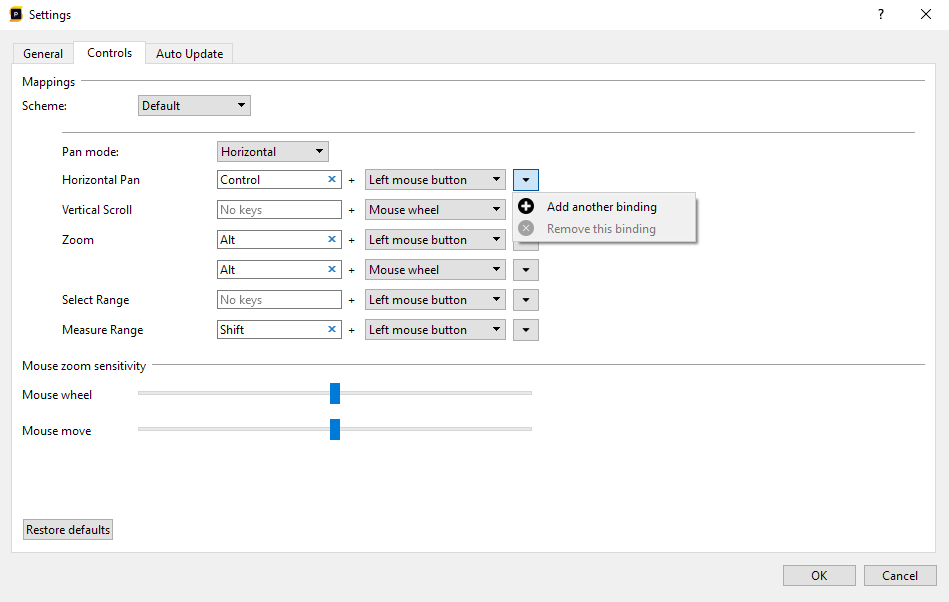
If you click 'Add binding', you can create an additional binding for an action. If any of the bindings for a single action is active, the action will be active. In the following example, we've bound the Pan action to both the left and right mouse buttons, so that they work on either left or right mouse button:
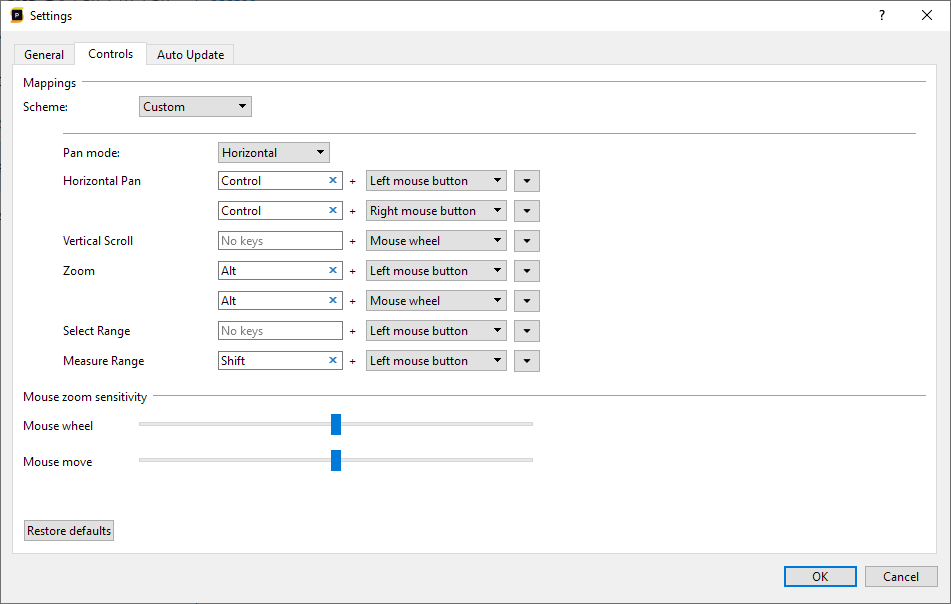
Although an action does not require a key, we recommend always binding a key for commonly used functions like panning and zooming: when a key is pressed it disallows interaction with the UI that resizes the threads, making panning and zooming a bit easier.
Each action should be configured with a mouse binding. It depends on the action what kind of bindings are supported. The left/middle/right mouse button bindings implictly mean a binding where the mode is activated through dragging the mouse. A mouse wheel binding is activated by simply scrolling the mouse wheel. The 'Zoom' action supports both dragging and mouse wheel bindings. The Vertical scroll only supports the mouse wheel binding. All other actions are drag operations.
The Function Statistics view
The Function Statistics view allows you to search for functions in your session and display statistics about them. Besides being able to display statistics for manual searches, it can also be populated from the Threads view, and it can be auto-populated by the CallGraph View and Function List. This allows you to get detailed statistics on functions for very specific contexts.
Manually searching for functions
Searching for functions can be performed by clicking on the text area in the top-left corner of the Function Statistics window:

This will bring up the find dialog. When typing, the list will be populated with functions in your session that contain your text:
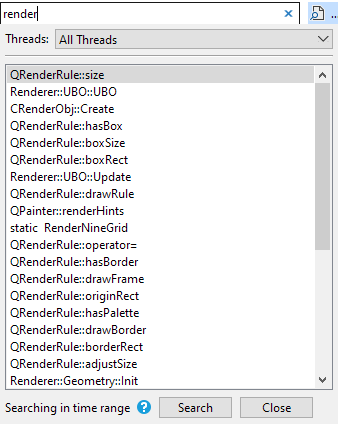
A function can be present in multiple modules. In this case, the function name becomes a group, with all the modules underneath it:
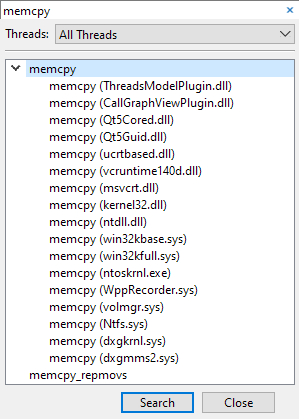
We can either select the entire group to find the function in all the modules, or we can select a function from one specific module.
The search will always be performed on the current time range selection in the threads view, as indicated in the bottom-left corner of the popup. If needed, the search operation can be further restricted to certain threads by clicking on the Threads panel:
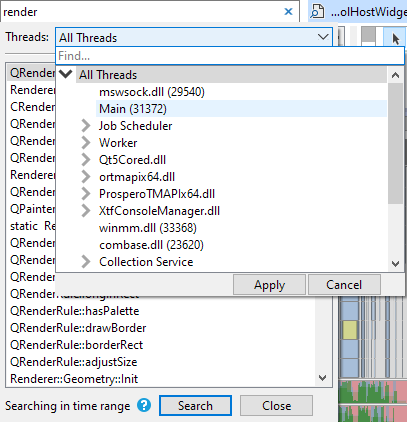
In the thread selection UI, threads are automatically grouped on thread name. Both single threads and thread groups can be selected by clicking on them, and then pressing 'Apply'. It is also possible to multi-select threads by holding CTRL and clicking on the threads and/or thread groups that you want to select. To quick-select a thread or group of threads, double-click the item, and it will apply the selection immediately. If your session contains multiple processes, the thread selection UI will display a checkbox that allows you to group threads by process, which will change the thread hierarchy so that the threads are separated by process at the root level:
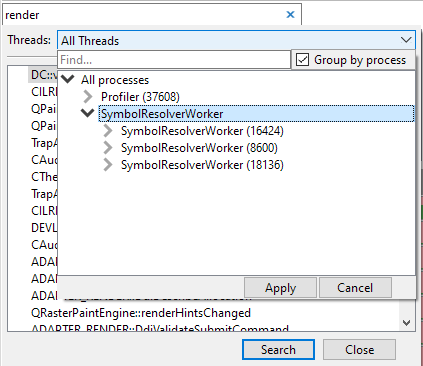
To start searching, press "Search". Each instance that was found in the Threads view will be highlighted:

The search will also populate the Statistics view for your function, as will be discussed in The Statistics UI.
The Statistics UI
After the Statistics view has been populated, there are three main areas that display timing information:

- On the left side is the Instance List. Each single function instance that was found is listed here.
- In the middle, the Instance Graph is displayed. This is a graph that contains the timings for all the instances. This graph can be zoomed in and out to get an overview of the timings of all your functions, making it easy to see the instance timings across the entire session.
- On the right side, statistics on the entire set of functions are displayed. This includes distribution information such as a Histogram, BoxPlot, averages and more.
Both the Instance List and Instance Graph are sorted on function duration by default. This makes it easy to spot the most expensive instances first. The sort order can be changed by clicking on the column headers in the Instance List. For instance, by clicking on the Start Time column header, both the Instance List and Instance Graph will be sorted on order of appearance in the session. This can be convenient for seeing how functions behave over time. To export instance data, the 'Copy to Clipboard' or 'Export To File' buttons in the Instance Graph's toolbar can be used.
The Instance Graph can be panned, and zoomed in and out. This works in the same way as how the Threads view is controlled. See Navigating the UI for more details. Because the graph can be zoomed in and out, a single bar can represent multiple invocations. In such cases, a single bar in the graph is colored to represent the average and maximum length of the invocations that it represents. The lighter blue represent the average time, the darker blue represents the maximum time. When hovering over a bar, this information is displayed in a tooltip:

In this example, the average Render time (~48ms) is much shorter than the peak Render time (~192ms). When zooming in on this graph, the combined bar will split into separate bars until you reached the zoom level where each bar is drawn separately. In this case, the bar is always light blue. The following image clearly displays the variation in framerate and why the average time is much lower than the peak time:

Clicking on an item in the Instance List or the Instance Graph will select it in all the other views: the Threads view, CallGraph view or Function List, and the Source view:
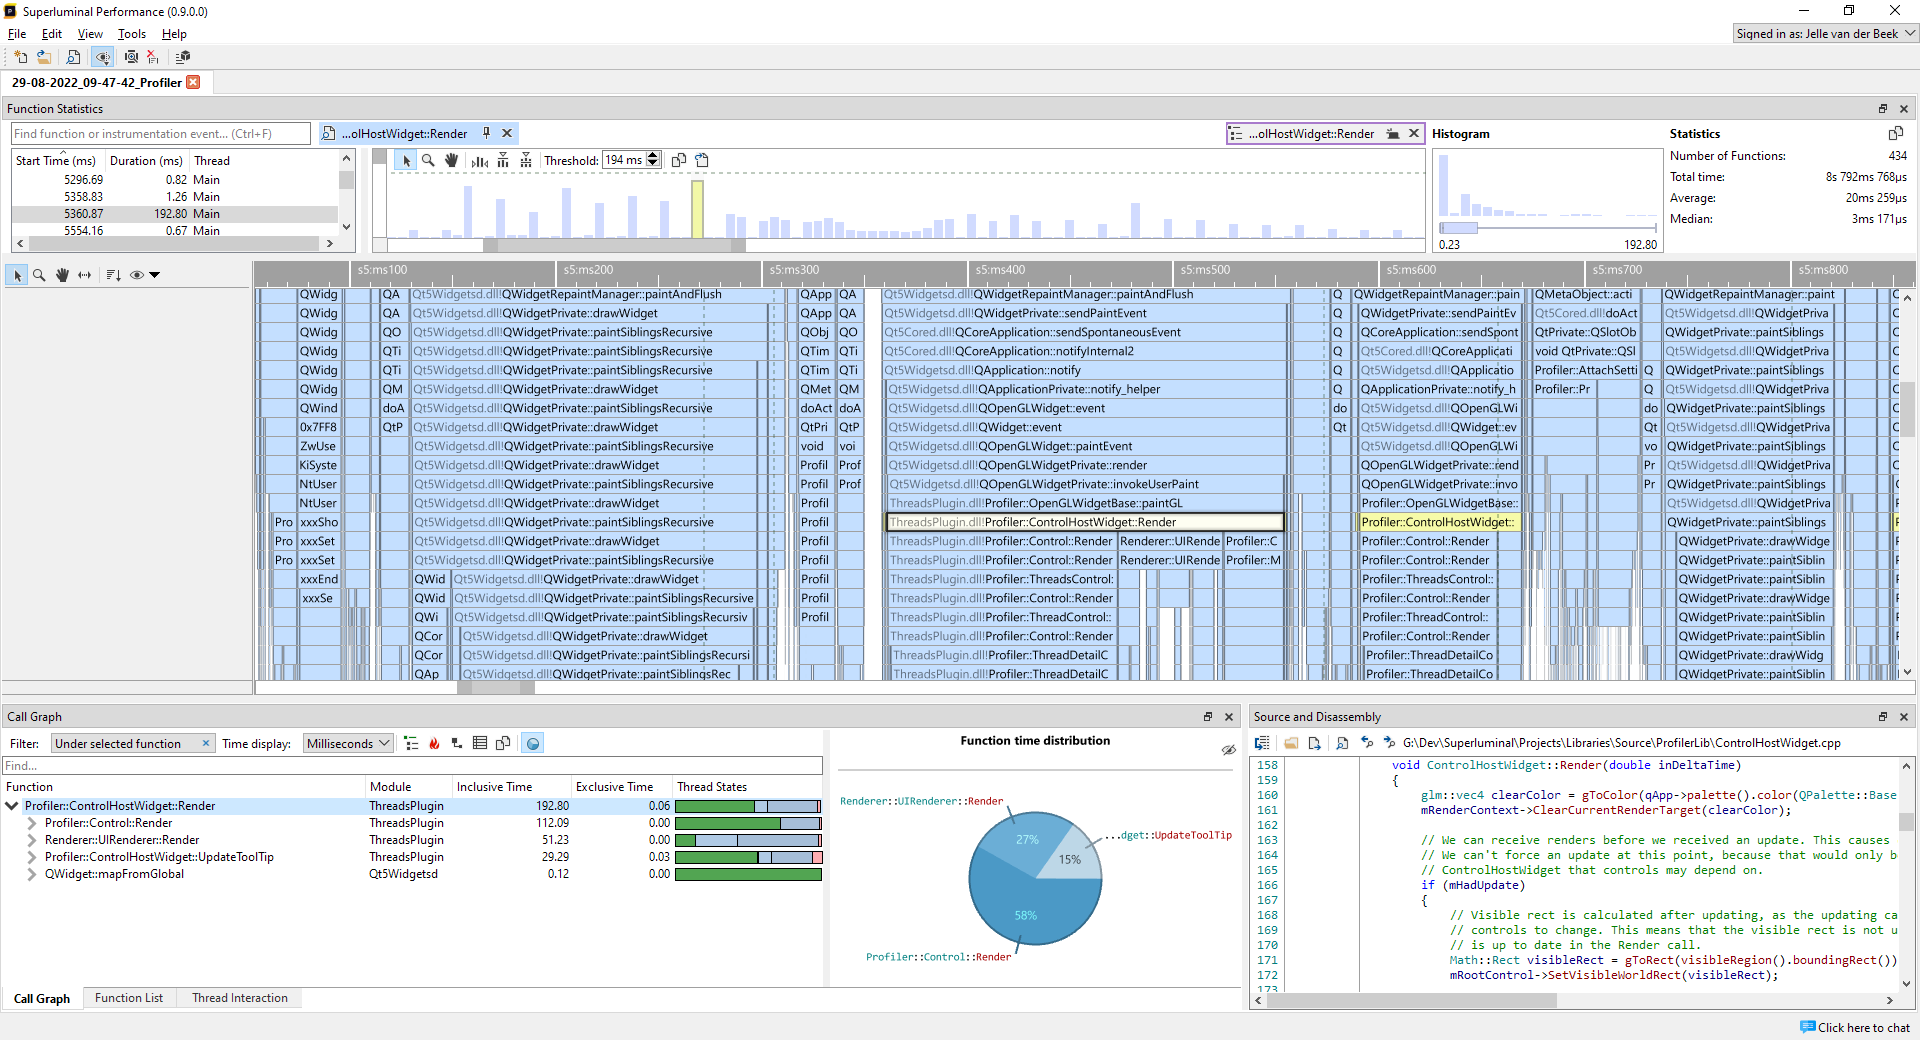
The Histogram and BoxPlot will make it easy to understand the distribution of your timings:

On the bottom-left, you can see the smallest time that was encountered, which is 0.38ms in this case, and in the bottom-right corner you can see the largest time encountered, which is 192.80ms. This already gives you an idea what the possible outliers may be. If we look at the histogram further, we see that the distribution is mostly on the left side of the graph. If we hover over the peak of the graph, we see that there were 79 invocations with the ~20-30ms range:

Depending on what the expectation for this function was, it may be possible that there are quite some calls here that are more expensive than expected or desired, and action might need to be taken to get the distribution within a space that you're more comfortable with, for instance, maxing out at 50ms, with the majority of the functions ranging in the 10-30ms space.
Although spotting outliers is a convenient tool in a histogram, you may also want to filter out the worst outliers because they skew the results too heavily. It is possible to set a threshold in the Instance Graph that will filter out the results that are above that threshold. This can be performed by dragging the dotted line, or typing in the threshold in the toolbar directly:

Any instance that has a longer duration than the threshold will be greyed out in the Instance List and displayed in a different color in the Instance Graph. The distribution and statistics are changed to only use the instances that are below the threshold.
Searching from the Threads view
While searching can be done manually by typing in the Function Statistics window, it can also be performed quickly through the context menu in the threads view. Right-click a function, and select 'Find all occurences':

This will perform a regular search and populate the Statistics views.
Searching from the CallGraph and Function List views
One of the most powerful features of the Statistics view is that it can also be populated from the CallGraph and Function List views. A CallGraph is a very lossy format because it combines information from all kinds of function instances and accumulates that into nodes. The information on each instance is lost. However, it can be recovered with the help of the Statistics window. Right-click a node in the CallGraph, and select 'View Statistics':
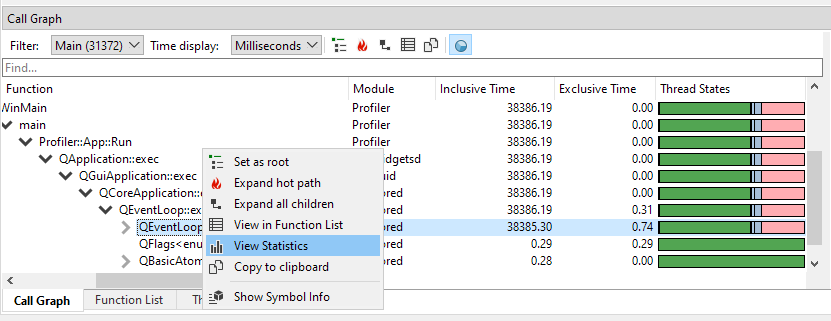
The Threads view will highlight all the instances that were accumulated in this node, and the Statistics window will display each instance for that particular node in the Statistics window. This allows you to see call counts, distribution and helps you to find all the individual functions that contributed to that specific node.
Using the context menu to view this information is not even necessary: populating the Statistics view for any selection made in the CallGraph or Function List can be done automatically. Whenever an item is selected in either the CallGraph or Function List, the Statistics window will display a 'context' item with a purple outline:

This item represents the currently selected item in either the CallGraph or the Function List. By default it is not selected, but once selected, the Statistics view is automatically populated with whatever was selected in the CallGraph or Function List.

Notice the purple color of the item when selected. Whenever this item is active, you will get instant Statistics information on your CallGraph or Function List selection.
History, pinning and context
When a search is performed, either through a manual search, or when finding instances through the Threads view, an item is created at the top of the Statistics window:

When more searches are performed, a short history will be maintained with your latest searches:

By clicking on the items you can switch between previous search results quickly. If you hover over an item, information is displayed on what the function was, what the search range was, and some basic statistics:

Any item can be discarded by clicking the cross button in the top-right corner of the item. If you'd like to keep the item around for a longer period of time, you can also pin it. When pinned, it will move to the right side of the window:

As explained in the Searching from the CallGraph and Function List views section, the Statistics window can also be populated automatically for each selection you make in the CallGraph or Function List. Whenever an selection is created in either the CallGraph or Function List, a context item will be displayed in the Statistics window, with a purple outline:

Whenever this item is active, the Statistics window will display the Statistics from the selection in the CallGraph or Function List automatically. Because there is only one context item, it will be replaced each time a new selection is made in the CallGraph or Function List. Just like pinning, the context item can be kept around for longer as well. The move button in the top-right corner of the item will move it to the stack. As a convenience, the context item will be moved automatically to the history stack whenever you are selecting instances in the graph, otherwise the graph would be lost immediately.
Instrumentation
The Statistics view also supports finding and displaying of instrumentation events. There is no distinction between searching for regular functions and searching for instrumentation events. The context that was passed along with an instrumentation event can be inspected when hovering over a bar in the Instance Graph:

The Threads view
The Threads view contains the data for all threads, with one row per thread. Each row displays the thread ID and name for that particular thread, as well as an overview of the high-level thread activity. Each row can be expanded to inspect more detailed data about that thread's activity. For information on how to set the thread name, see the Thread names section.
Multi-process captures
If a session contains multiple processes, the threads view has some additional elements to control processes. Most importantly, the left side contains colored vertical panels that represent a process group:
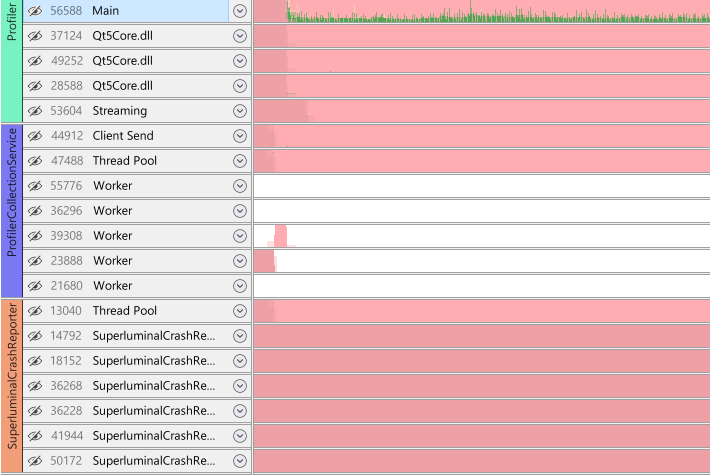
These vertical panels are not present in a single process capture.
The threads view does not rigidly group threads by process: threads can be freely ordered across processes to make sure that the important threads can be positioned adjacent to each other. A process group is a group of adjacent threads that belong to the same process. This means that, depending on the ordering of threads, there can be multiple process groups that belong to a single process. This gives a lot of flexibility in management of processes and threads.
Selecting threads
There are many ways to create a selection in the threads view. The time range selection and thread selection work as a filter for the CallGraph, Function list, and Source view. So when selecting threads, these views will respond to the selection that was made. The thread selection will remain in sync with CallGraph and Function list views: when a different set of threads is selected in any of these views, the Threads view will also select these threads.
Threads can be selected by clicking on the thread name. When holding the CTRL key while clicking, threads can be either added to- or removed from the selection. When holding the SHIFT key, the range of threads between the last clicked thread and the currently clicked thread is added to the selection:
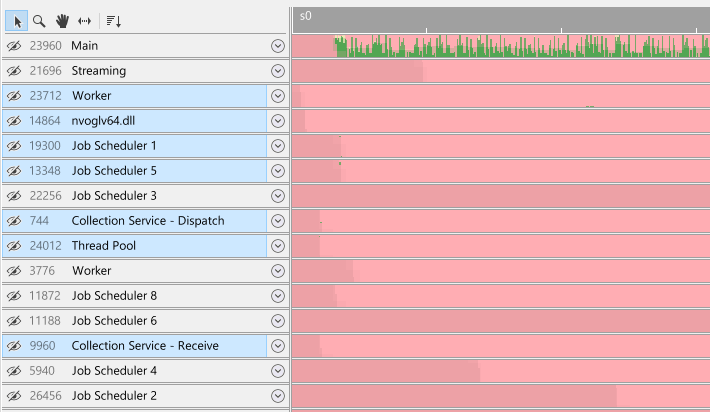
If your session contains multiple processes, selection of process groups works the same way as selecting threads. Click on the process group to select all threads within a process group. When holding the CTRL key while clicking threads or other process groups, threads can be either added to- or removed from the selection. When holding the SHIFT key, a range select of threads within the process groups is performed:
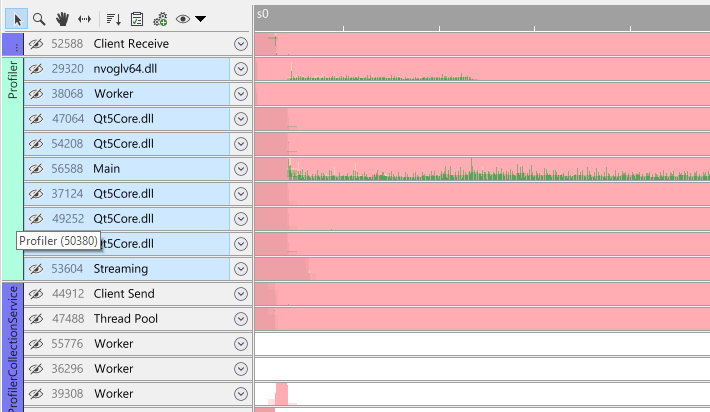
Another convenient way of quickly selecting threads is by selecting 'similar' threads. Right-click on a thread to open the context menu:
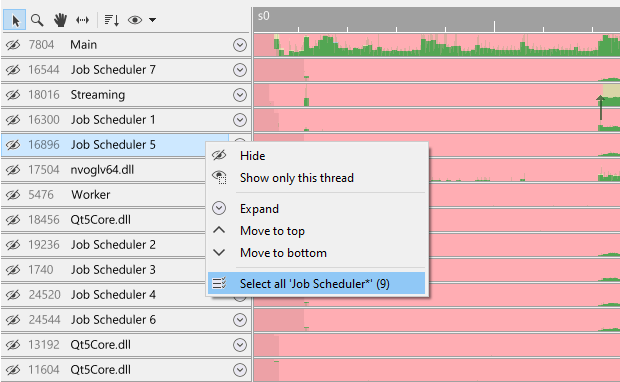
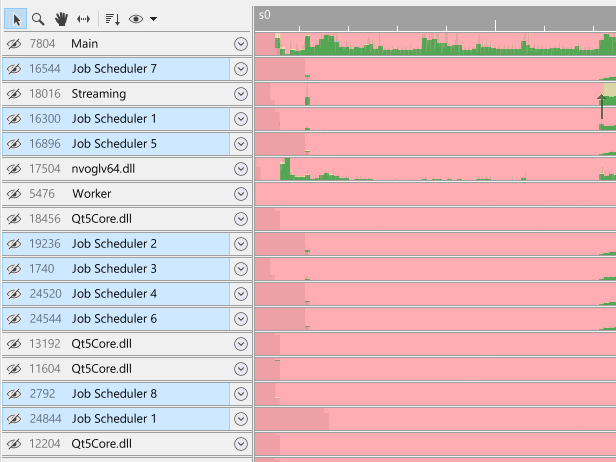
The context menu will have an option to select threads that are named similarly to your thread, and it will indicate how many of these threads are present in the capture between parenthesis. In this case, selecting this option will select nine threads that all start with the name 'Job Scheduler':
To select on a per-process basis, right-click on a process group to open the process group context menu:
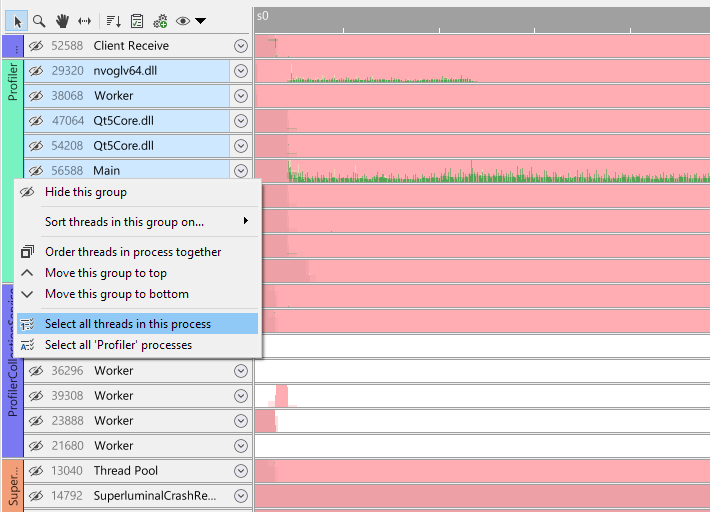
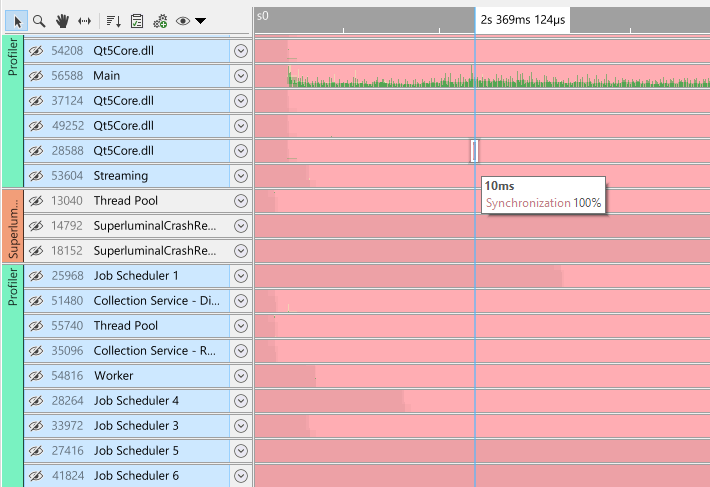
Because process groups do not necessarily contain all threads for a process, it is convenient to still be able to select all threads within a process. By clicking 'Select all threads in this process', all threads across process groups for that particular process are selected:
The 'Select all name processes' option will select all threads that belong to a process with the same process name. For instance, if you have farmed out work to multiple child processes that are all named 'MyWorker', using this option will select all threads in all processes named 'MyWorker'.
Once threads are selected, they can be reordered or hidden from the view. See Sorting and reordering, or Hiding and unhiding for more information.
Expanding and collapsing
To expand or collapse a thread, press the expand icon:
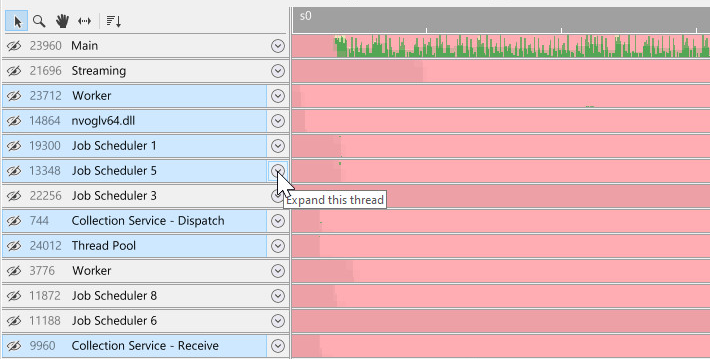
This will expand a single thread fully so that all the activity on that thread is displayed:
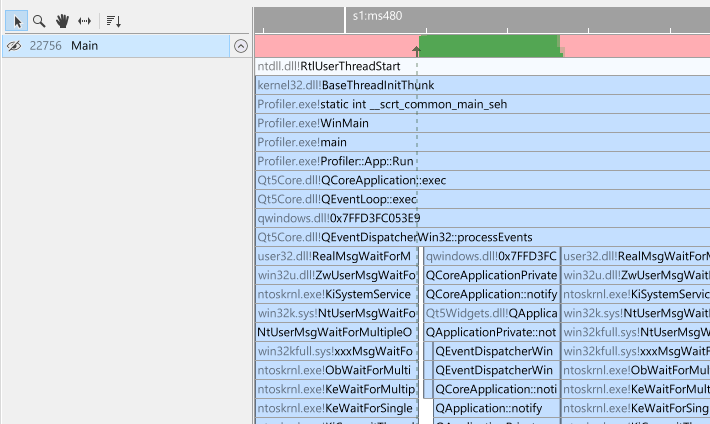
Threads can also be expanded by dragging the horizontal separator between threads. This is a convenient way to expand threads only partly. The cursor will switch to a resize icon when hovering over the horizontal separator:

As a fast shortcut, double-clicking on the thread name will always toggle the collapse/expand state as well.
Thread activity and interaction
Each thread is initially in a collapsed state, giving you a high-level overview of thread activity and how threads interact with each other.

The green color in the overview means the thread is in an executing state. Any other colors are variations on wait states. When hovering over the various colors, a tooltip is displayed explaining what the thread was doing at that time.
Depending on the zoom level, arrows are visible that indicate how threads interact with each other: how a thread is unblocked by another thread. This is very convenient to see how threads interact with each other. When hovering over a wait state, the arrow for that wait state will become visible and will animate. In the following example, the Streaming thread was blocking and waiting to be unblocked. It eventually got unblocked by 'Job Scheduler 3'. From what we can deduce at this point, it appears that a streaming thread is waiting for some command to (possibly) read or write data. A job in the job scheduler eventually kicks it to perform that operation.

A thread can be unblocked by another thread, but it may not yet be scheduled in by the thread scheduler. The length of the horizontal part of the arrow indicates the duration between the thread being set into a ready state and the time it was actually scheduled in by the OS. When hovering over a wait state, or when hovering over an arrow, click the arrow or wait state to get more information about the blocking and unblocking callstacks. We can now determine more precisely what was going on in our example.

We can see that Job Scheduler 3 called RequestSave. By clicking on the function, we can see the source code for that function. The source code clearly shows that we unlock a condition, allowing the streaming thread to perform the write. If we want to navigate between the blocking and unblocking stack, we can click the toolbar buttons on top of the stacks to navigate to the various stacks in the Threads view quickly.
Inspecting interaction between threads works the same way as interaction between processes:
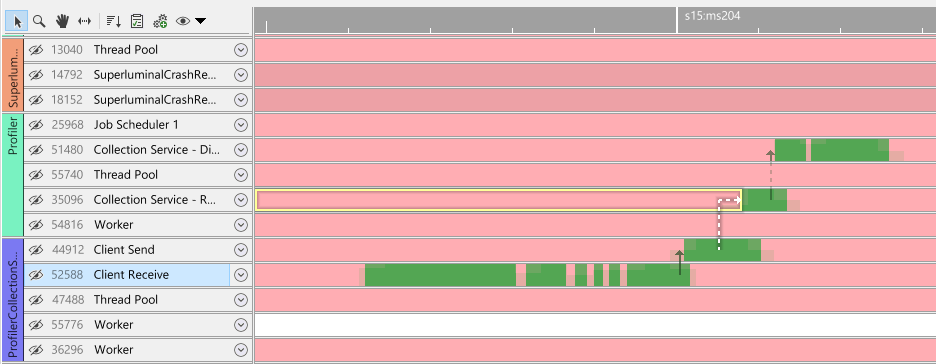
In this example we can see that a thread in ProfilerCollectionService wakes a thread in the Profiler itself. This is an example of network communication on a local machine where threads within processes are waking each other when data arrives. This is just as easy to follow within the threads view as regular thread interaction.
Examining thread execution
When expanding a thread, a full recording of that thread is displayed.
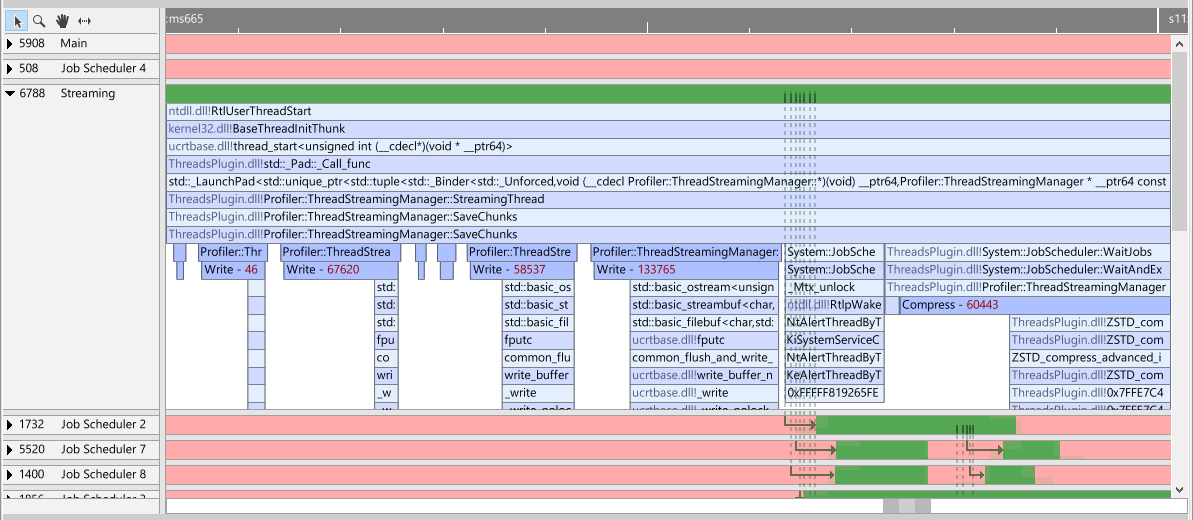
In this example, we see our Streaming thread executing code. The light-blue bars are regular sampled functions, the darker blue bars are instrumentation bars. To add instrumentation events, use the Performance API. Notice that the instrumentation is merged into this view as if it was part of a regular callstack. Also notice that these events have additional information on them. The numbers in red are file sizes that we sent to the profiler. This is convenient for us to understand the ratio between write time, size and compression size. Another example is when we hover over one of the events:

The tooltip displays the length of the bar, and in the case of instrumentation event, the context. In this particular case we can see the filename that we were writing to. This can all be accomplished by providing context to instrumentation events. When we click on a bar, we select it and the CallGraph and Function list views will respond by displaying the information that is related to this particular bar and time range. To understand more about time selections, see Selecting ranges on the timeline.
Selecting ranges on the timeline
A time selection can be created by dragging a selection. By default this can be done simply by left-clicking and dragging a range, but this can reconfigured in the input bindings. When dragging a selection, the area outside of the selection is dimmed.
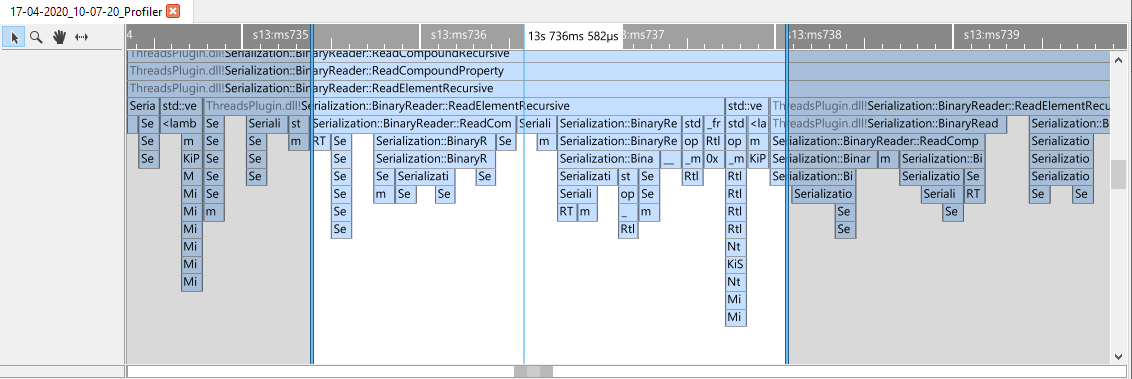
The callgraph, function list and source views will respond to the selection that was made and display only the information for this selection.
If you click on a bar within the time range selection, only the part of the bar will be selected that fits within the selected range:

Clicking outside of the selected range, or pressing the escape button will cancel the selection.
Measuring time
It can be convenient to measure how long something takes. The measure function can be accessed in two ways. The first one is by clicking the measure toolbar button:
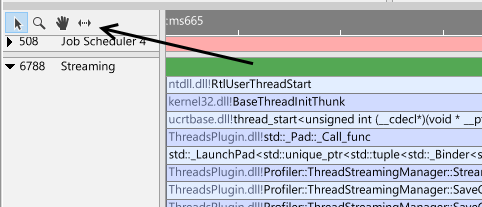
When in measure mode, click the left mouse button and drag the mouse. You will see the timing for that time range.

To exit the measure mode, click the Select button in the toolbar. A quicker way to measure the length is to use the input binding for measuring. This is set to SHIFT by default, but can be altered by selecting Tool/Setting in the menu, and then selecting Controls.
Function context menu
When clicking on a function in the timeline, a number of convenience functions are available:

- Copy. Copies the full module name and function name to the clipboard.
- Copy Advanced. Offers specific ways of copying the function, including copying the callstack leading to the function.
- Find all occurences. Performs a search of the selected function within the current timeline selection, across all threads.
- Select time range. Set the time range to the start and end of this function.
- Set as CallGraph root. Selects the current function and jumps to the Call Graph view.
- Set as Function List root. Selects the current function and jumps to the Function List view.
- Show Symbol Info. Displays the Symbol Resolve Diagnostics for the selected function, allowing you to easily diagnose symbol resolving issues.
Sorting and reordering
It can be convenient to sort the threads in a particular way so that threads are grouped together in a logical fashion. Superluminal offers ways to globally sort and manually reorder threads. Threads can be globally sorted through the sort toolbar button:
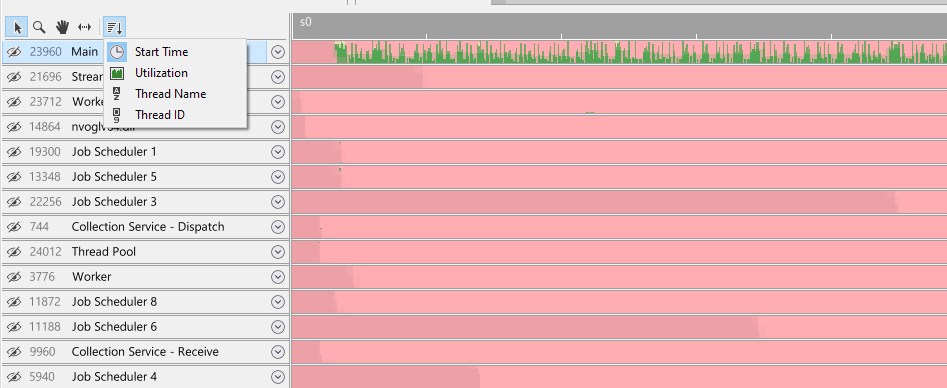
There are five ways to sort threads globally:
- Process. Sorts all threads by their process name first, and then by thread name. This option is only available for multi-process captures
- Start time. Sorts all threads by their start time. If threads have identical start times, the thread with the most utilization is preferred
- Utilization. Sort all threads by their utilization (i.e. how much time they spend executing code)
- Thread name. Sort all threads by their name
- Thread ID. Sort all threads by their ID
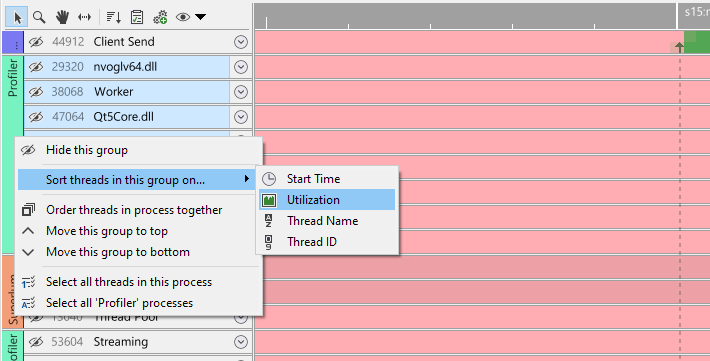
If your capture contains multiple processes, you can also sort threads within a process group. This makes it possible to first sort globally on something like Start time, and then for a specific process, to sort on something else, like Utilization:
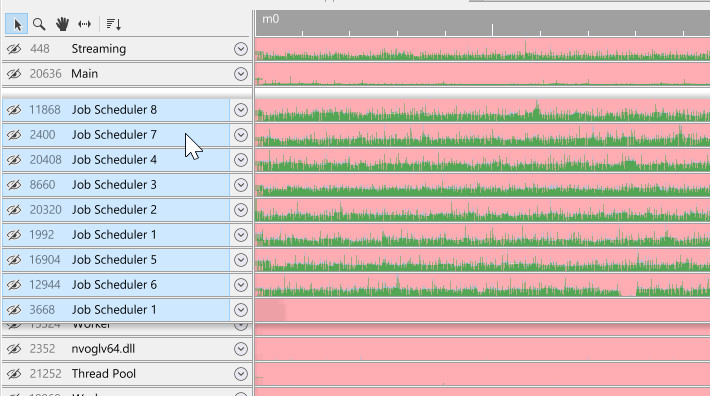
Alternatively, we can reorder threads manually by dragging them. First, select the threads to reorder. To understand how to multi-select threads or process groups, see Selecting threads. Then, simply drag the threads to their desired position:
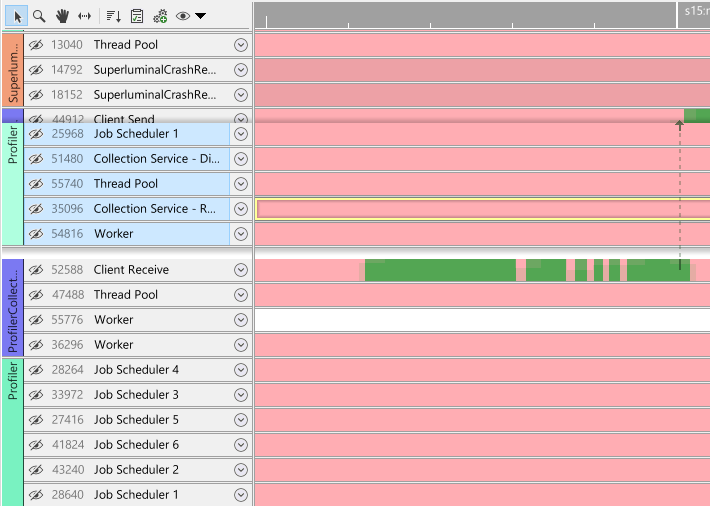
We can also reorder process groups by dragging them. First, select the process groups to reorder, and then drag them to the desired position:
It can be convenient to quickly order threads together, perhaps because they have a lot of thread interaction, or because they logically belong together. Select the threads that you want to place side by side, and then order them together through the context menu:
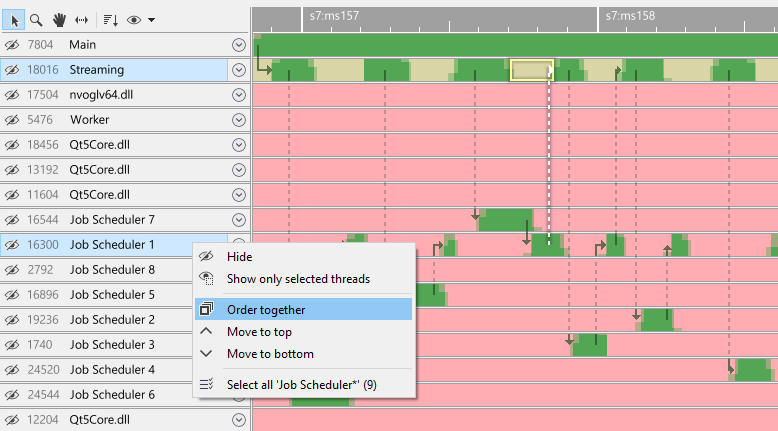
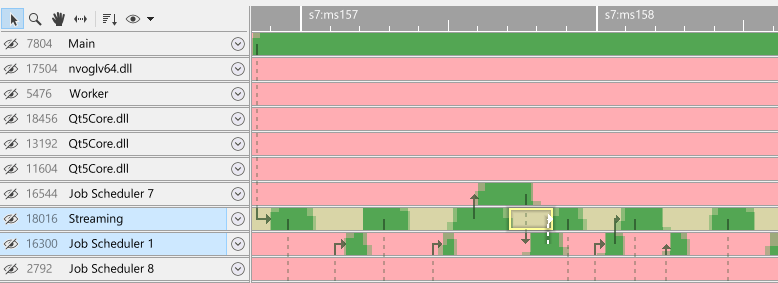
In this example, the streaming thread is woken by a Job Scheduler thread. We want to order these threads together. After clicking 'order together', the view looks like this:
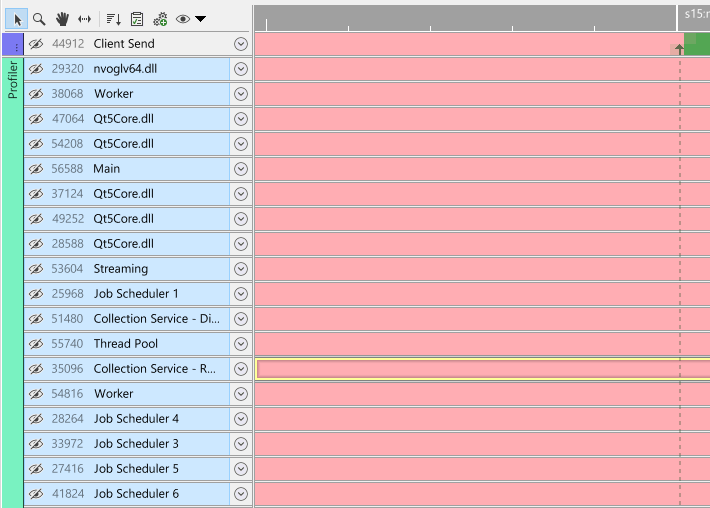
Similarly, we can order all threads in a process together. As explained in the sections on multiple processes, a process group does not necessarily contain all threads for a process. To group all threads for a process together quickly in a single group, right-click a process group and select 'Order threads in process together':
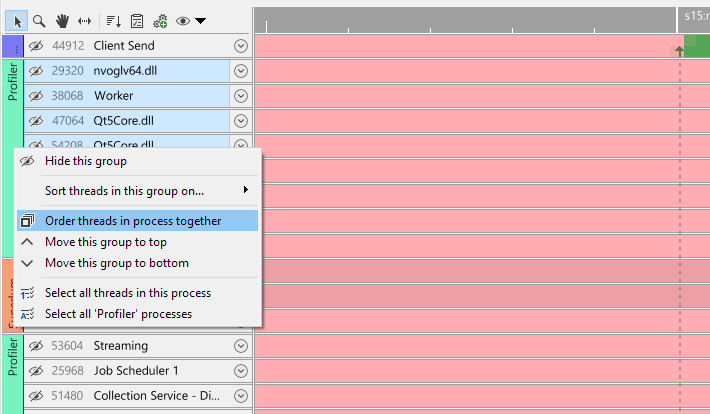
This will merge all process groups for that process together:
Manual hiding & unhiding
Often when profiling, not all the threads are of importance for your profiling task. These threads can be hidden from the view. First, select the threads to hide. To understand how to multi-select threads, see Selecting threads. Then, simply click the hide icon:
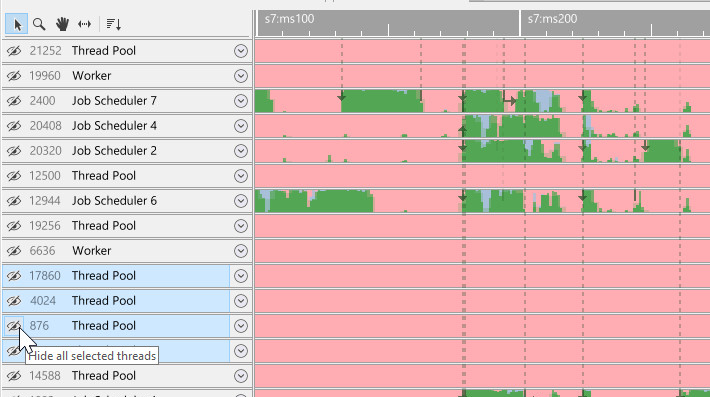
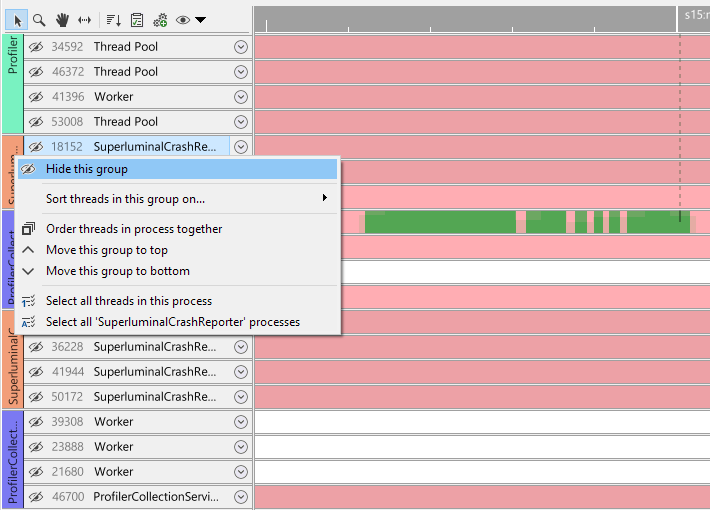
If your capture contains multiple processes, you can also hide all threads in a process quickly by right-clicking the process group, and then selecting 'Hide this group':
Once threads are hidden, a button on the toolbar will appear to unhide any threads that you have hidden. By clicking on it, the unhide UI will appear:
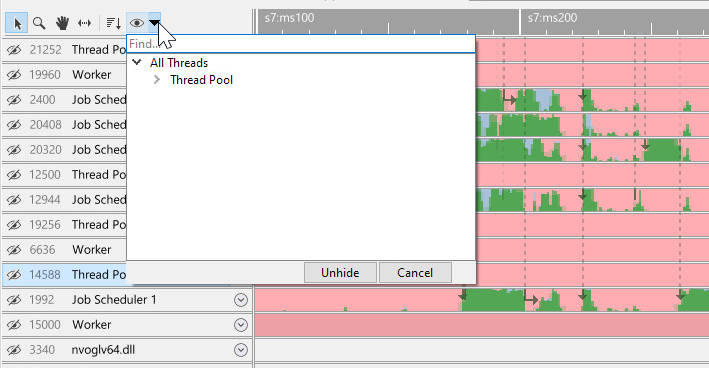
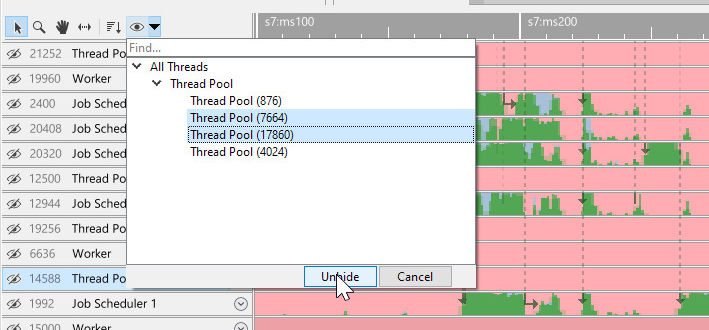
Here we can unhide threads by double-clicking on single threads or groups of threads. We can also multi-select what threads we want to unhide and then selecting 'unhide':
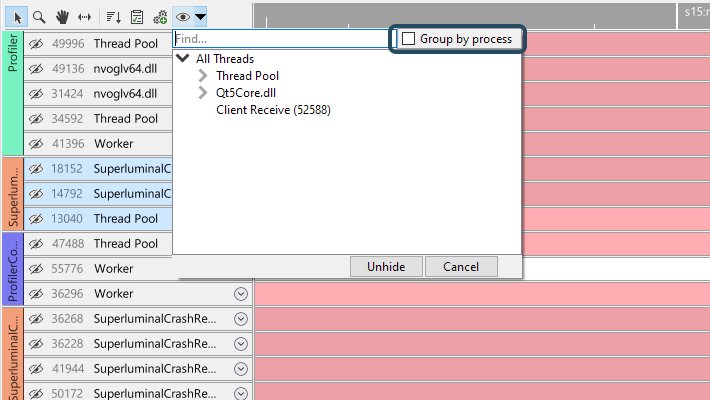
In case threads are hidden in multiple processes, the unhide UI will display a checkbox that allows you to group threads by process:
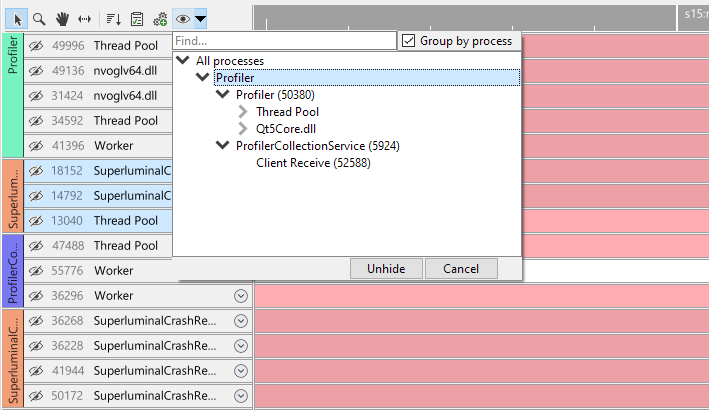
When clicking 'Group by process', the thread hierarchy will change so that at the root level the threads are split by process first:
Instead of hiding threads manually, it is also possible to automatically hide them using a ruleset. See Auto thread hiding for more details.
Auto thread hiding
It is rather common that a single application is being continously profiled and optimized. In those situations it can be tedious to hide the threads that you are never interested in for each subsequent capture that you make. Instead of manually hiding threads each time, it is also possible to automatically hide certain threads based on a ruleset. The ruleset is accessible by clicking the Thread hiding rules button in the toolbar:

This will bring up a dialog where rules can be setup for automatically hiding threads after a session is opened for the first time:
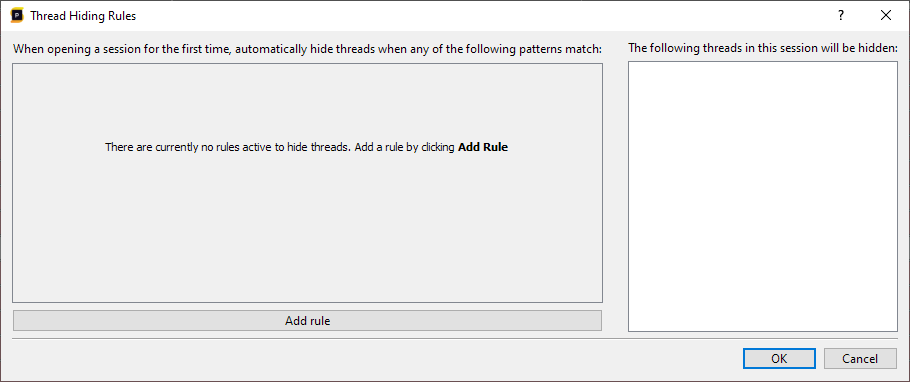
The left panel will display the rules, and the right panel will display a preview of what threads would be hidden if the rules were applied to the current session. Initially there will be no rules, so to start adding rules, click the Add rule button:
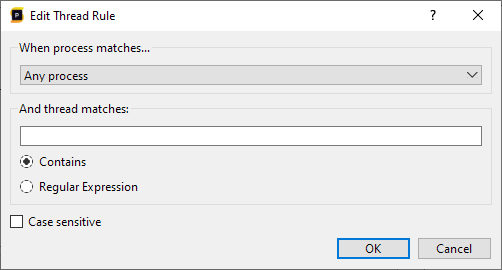
This opens a dialog where a single rule can be added. The rule will apply to a process and thread filter. We can select whether the rule applies to all processes, or a selection of processes. For both the processes and threads, we can either use a substring match (the 'contains' option), or to use a regular expression for process or thread name matching. And finally, we can perform a case sensitive or case insensitive match. For example, using the following rule we will hide all threads that contain 'Worker', but only for processes containing 'Profiler':
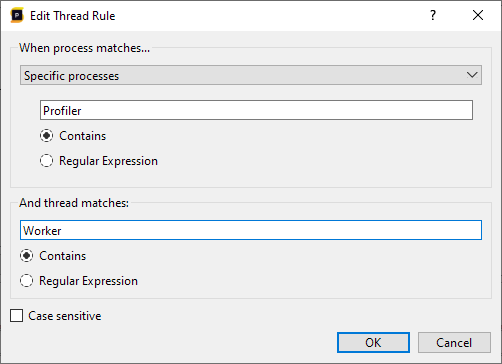
By pressing OK, the rule is added:
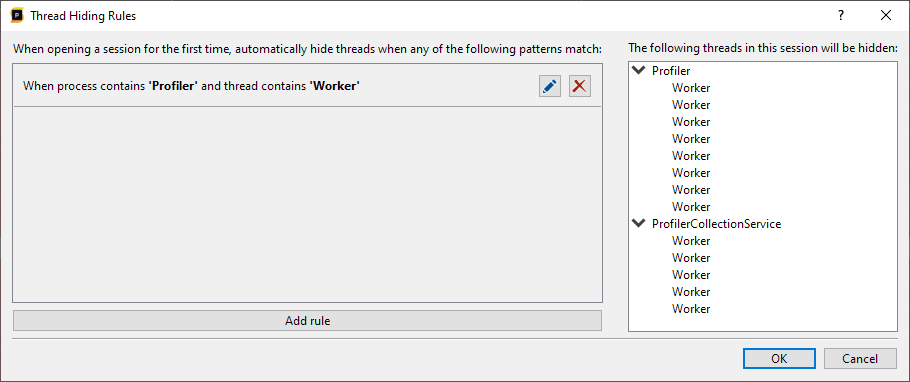
We can now see the rule in the list, and the preview shows what threads would be hidden if we would apply this to the current session. As we have multiple processes that match the process filter, we can already see that threads will be hidden for both the 'Profiler' and 'ProfilerCollectionService' processes.
More rules can be added as needed. Each new rule acts like an OR, as we are additionally hiding more threads:
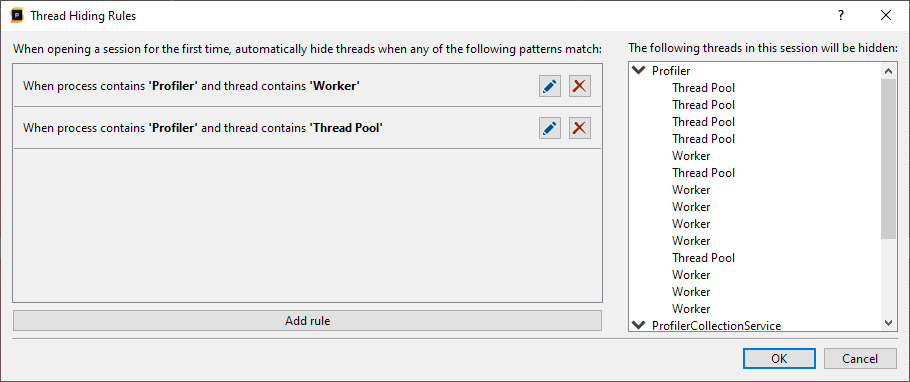
From here on we can edit or remove existing rules. Once we're happy with the ruleset we can press OK to apply the changes. The ruleset is global to all sessions and will run each time is session is opened for the first time. For convenience, the ruleset can be reapplied to the existing session. This does mean that any manually hidden threads could be made visible again. When pressing OK, the following popup will appear to request whether you'd like to reapply the rules to current session:

The Thread hiding rules are also accessible in the menu, by choosing Tools/Options/Thread Hiding Rules. However, the session preview window will not be accessible there as the options menu is global and not bound to a specific session.
The CallGraph view
The CallGraph view displays statistics for each function in a hierarchial fashion.
Timing information
Each function is represented by a node in the CallGraph. For each function, we can view:
- Inclusive time, the time of the function itself and all its children, recursively
- Exclusive time, the time spent only in the function itself
- Thread state, how much time the function spent executing or waiting (and in what wait states)
Timings can be displayed in several formats by using the 'Time display' combobox in the toolbar. In the following example we have switched to 'Absolute %':
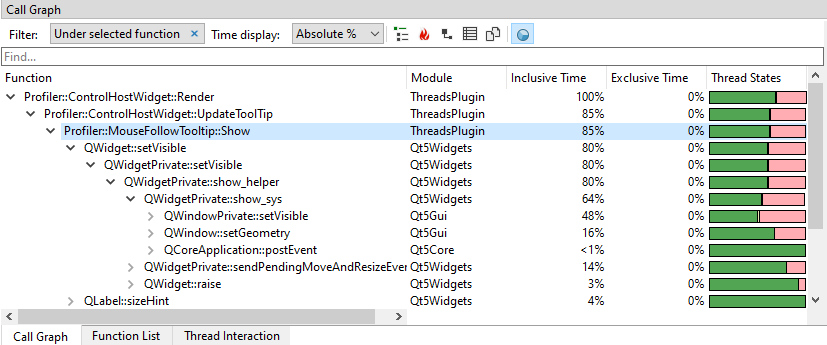
The time display options are:
- Milliseconds.This is the default format. All timings are in absolute time units.
- Relative %.Each node in the tree will display the percentage of time spent, relative to the parent node.
- Absolute %.Each node in the tree will display the absolute percentage within the entire graph.
Filtering
The view can be filtered in a variety of ways. By default, the view will display data for the active time range. If no time range is selected, the time range for the entire session is used. For information how to select and clear time ranges, see Selecting ranges on the timeline. To select what threads to filter on, click on the Filter combobox. This will open up a thread selection UI:

In the thread selection UI, threads are automatically grouped on thread name. Both single threads and thread groups can be selected by clicking on them, and then pressing 'Apply'. It is also possible to multi-select threads by holding CTRL and clicking on the threads and/or thread groups that you want to select. To quick-select a thread or group of threads, double-click the item, and it will apply the selection immediately. In the following example, we clicked on the 'Job Scheduler' group, which will filter to all the Job Scheduler threads:

If the session contains multiple processes, the CallGraph will combine the timings of all processes in one CallGraph. This is incredibly powerful as it allows you to see the accumulated timings for multiple processes. For instance, if you have farmed out work to a number of worker processes that run in parallel, you would most likely want to view these timings as if it was one application. By default, the CallGraph does exactly that. In the Job Scheduler example above we would see the timings of all Job Scheduler threads across all captures processes. In some cases, however, it may still be convenient see the timings per process. To accomplish this, the thread filter dialog contains a 'group by process' checkbox if the session contains multiple processes:

When clicking 'Group by process', the thread hierarchy will change so that at the root level the threads are split by process first:

If we select a process node, we will filter the CallGraph to that process only. If we select threads under the process, we will see only the selected threads for that process. Again, any combination of selections will work, so you can still multi-select and pick the threads you would like to inspect from multiple processes.
An alternative way of filtering data in the CallGraph view is by clicking on a function in the threads view. The view is now filtered so that is displays only the selected function and all its children:

To clear this function filter and return to the thread selection UI, click on the cross icon in the filter.
Context menu & toolbar
There are a number of convenience functions to make navigating the callgraph easier. They are accessible through the toolbar and through a context menu that can be accessed by right clicking on an item in the callgraph:

- Copy. Copies all columns from all selected items to the clipboard.
- Copy Advanced. Offers specific ways of copying the selected function to the clipboard, including the stack leading to the function.
- Set as root. Filters the view to a specific node, which will carry over to the Function List. See Setting a custom root for more information.
- Expand hot path. Recursively expands all the child nodes that have the highest inclusive time.
- Expand all children. Expands all child nodes of the currently selected node.
- View in Function List. Selects the function in the function list so that you can see what the accumulated costs for the function are.
- View Statistics. Populates the Function Statistics view with information from this node. More info on how the Function Statistics can be automatically populated for each selected node can be found here.
- Show Symbol Info. Displays the Symbol Resolve Diagnostics for the selected function, allowing you to easily diagnose symbol resolving issues.
Pie chart
The pie chart on the right side of the CallGraph mirrors the statistics of the callgraph, but in a graphical way to make sure you can see the distribution of the timings at a glance. The pie chart can be navigated as well and remains in sync with the CallGraph on the left side. By hovering over the pie chart, the timings are displayed in a tooltip and the full name of the function is displayed in the header. In cases where you need more space for the CallGraph, the pie chart can be hidden by pressing the hide icon in the top right corner of the pie chart.
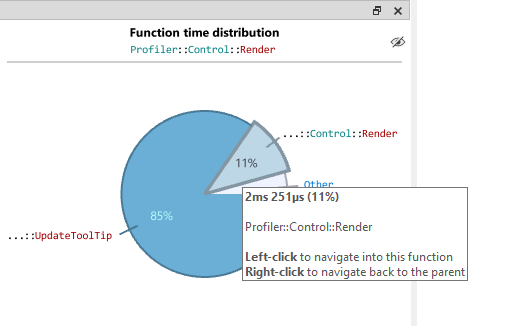
The pie chart can be navigated by hovering over a pie piece and clicking the left mouse button. To go back to the caller, right-click anywhere on the pie chart.
When navigating through the CallGraph either by selecting functions in the tree or in the pie chart, the Source and Disassembly view is updated to display timings based on the selection that was made.
Setting a custom root
It can be convenient to only display a part of the Call Graph. You can filter the view to a specific node by right-clicking it, and selecting 'Set as root'. The toolbar will indicate that the view is now filtered to a custom node:

This filter works in combination with other existing filters, like a time range selection, or a function that was clicked in the timeline view. The filter can be removed by clicking on the cross icon on the filter itself.
A powerful feature of this filter is that it carries over to the Function List as well. When we switch to the Function List, we can see the filter still being active:

This means that we can view the accumulated timings of a function, specific to a node in the Call Graph. For instance, we could see the combined timings for a memcpy function, but only for a specific branch in the Call Graph.
Recursion folding
When code recurses, it can be hard to get an overview of the timings of a function, or the functions that it is calling. The timings can be scattered over the various stacks, while most often you would like to see the accumulation of the recursion. Fortunately, this problem can be solved through 'recursion folding'. Any function that is recursive will have a button with a recursion icon in front of it:
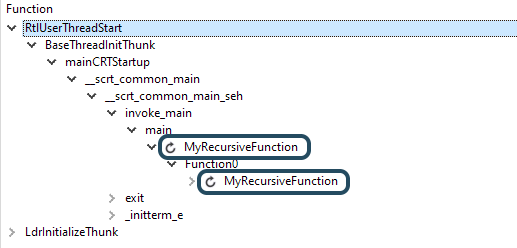
When the recursion button is pressed, all recursive calls for that function will be folded into that node. This will add all the exclusive time together, and merge all calls to subfunctions. To see what that means, let's look at an example:
void Function0()
{
	MyRecursiveFunction(1);
}

void Function1()
{
	MyRecursiveFunction(2);
}

void MyRecursiveFunction(int inLevel)
{
	// Some expensive operation
	switch (inLevel)
	{
	case 0:
		Function0();
		break;

	case 1:
		Function1();
		break;
	}
}
This code recurses indirectly, and it takes different paths through Function0 and Function1. In a CallGraph, you would see MyRecursiveFunction calling either Function0 or Function1, and the Source view would display the exclusive time for only one node:

When we press the fold button, we see MyRecursiveFunction calling into both Function0 and Function1, both in the CallGraph and in the Source view:

This is a very powerful way to understand the timings for complex recursive code. Each node can be folded separately, and can also be unfolded by clicking the recursion icon again.
Sometimes, the timings that you see can be a bit hard to understand at first. Let's look at a very simple example:

In this example, MyRecursiveFunction is calling Function0, which is again calling back into MyRecursiveFunction. When we fold the recursion, the following timings appear:

Here we can see that Function0 is greyed out and that it contains no time at all. This may be a bit unexpected at first, but it is actually correct. All the time that was spent in the second instance of MyRecursiveFunction was attributed to the first instance of MyRecursiveFunction. This causes the inclusive time for Function0 to go to zero, because all its children have been merged into the first instance of MyRecursiveFunction. For clarity, we still display the node, but greyed out. If Function0 would have done more than just calling into MyRecursiveFunction, there would still be time attributed to it: the time that was not spent in the recursion.
Unattributed time
Generally, timing information is separated into inclusive time and exclusive time. You may encounter that nodes in the CallGraph or function in the Function List contain either 'unattributed wait time' or 'unattributed executing time'. This is visible when hovering over a node in the CallGraph, or a function in the Function list:
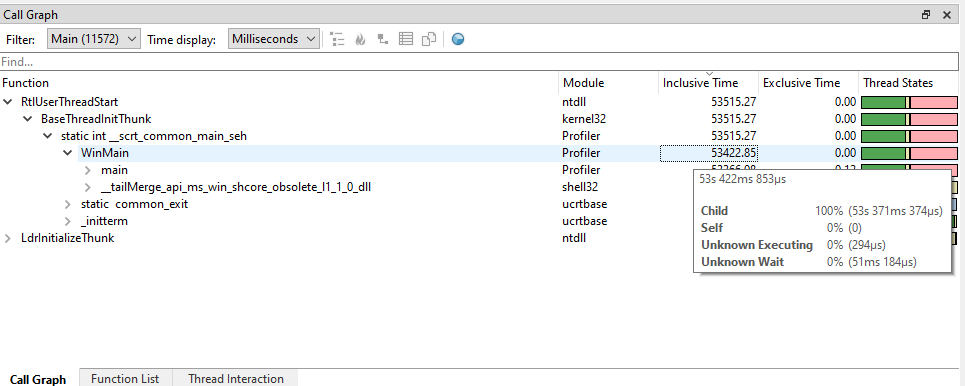
This means that we know that the thread was either waiting or executing, and it was likely spent in this function, but information was lacking to know for sure.
To understand what this means, it helps to understand a bit more how time is measured. At the root, Superluminal measures wallclock time. All time on the timeline is attributed to some function. Besides being able to measure wallclock time, this enables us to show thread states for functions, and we can identify function instances. This is fundamentally different from profilers that purely count samples: wallclock time cannot be measured, nor can thread states per functions be determined, or function instances be identified.
The consequence is that all time on the timeline, either waiting or executing, has to be attributed to a function. Generally, with a steady sampling rate, and information about context switches, this is very straightforward. If we receive two samples in sequence, we can attribute the time between those samples to that function. The question is what should happen in cases like this:
- There is a gap between samples that is much larger than the sample interval
- Samples are missing for some period of time
- Stack information is missing or broken (sometimes samples simply do not carry stack information, but this issue also occurs when modules are compiled with Frame Pointer Omission enabled. See Compiller & Linker Settings for more information)
These situations cause 'gaps' on the timeline, and the question is how we attribute the time in those gaps. We therefore split exclusive time into two categories:
- The 'exclusive time', which is the time based on actual samples falling into the function, which is guaranteed to be correct
- The 'unattributed executing time', which is the executing time that was attributed to this function. This is most probably correct, but we can't say for sure. It is generally non-existent or very small, but if it isn't, it is probably caused by one of the reasons listed above.
In case stack information was missing while the thread was in a wait state, we attribute that time to 'unattributed wait time'.
The Function list view
The Function list view displays a flat, sorted list of functions. Its purpose is to show aggregated times for a function, regardless of the stack. The CallGraph view is an excellent tool for understanding the performance costs of a single path in the code, but in a CallGraph view, it is more difficult to find the combined cost of multiple invocations of the same function from different code paths. The function list view is therefore very convenient for finding the combined time spent in a function, either inclusive or exclusive.
Timing information
The view can be sorted on inclusive time or exclusive time by clicking on the column headers:
- The Inclusive time is the time of the function itself and all its children, recursively
- The Exclusive time is the time spent only in the function itself
Timings can be displayed in several formats by using the 'Time display' combobox in the toolbar. In the following example we have switched to 'Absolute %':
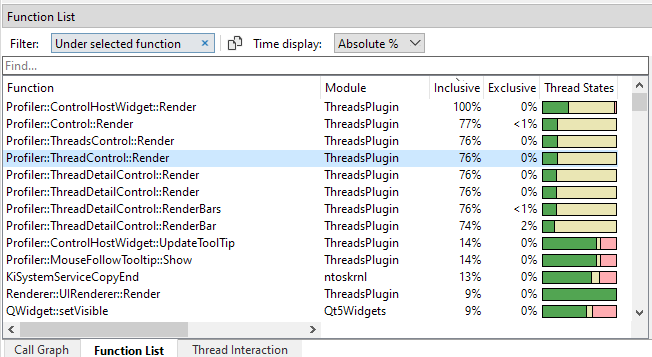
The time display options are:
- Milliseconds.This is the default format. All timings are in absolute time units.
- Absolute %. Each function in the tree will display the absolute percentage given the current filter.
Filtering
The view can be filtered in a variety of ways. By default, the view will display data for the active time range. If no time range is selected, the time range for the entire session is used. For information how to select and clear time ranges, see Selecting ranges on the timeline. To select what threads to filter on, click on the Filter combobox. This will open up a thread selection UI:
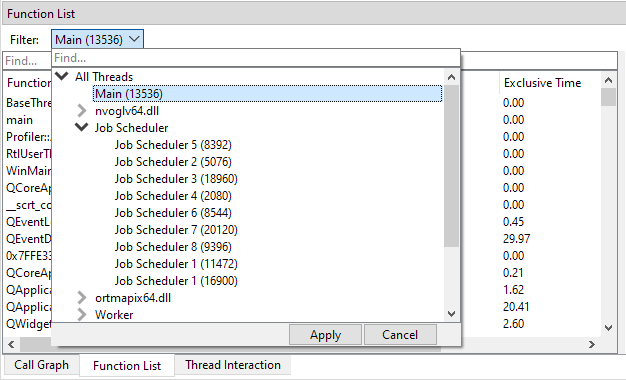
In the thread selection UI, threads are automatically grouped on thread name. Both single threads and thread groups can be selected by clicking on them, and then pressing 'Apply'. It is also possible to multi-select threads by holding CTRL and clicking on the threads and/or thread groups that you want to select. To quick-select a thread or group of threads, double-click the item, and it will apply the selection immediately. In the following example, we clicked on the 'Job Scheduler' group, which will filter to all of the Job Scheduler threads:

If the session contains multiple processes, the Function list will not only combine timings of the same function across stacks, but also across processes. This is incredibly powerful as it allows you to see the accumulated timings for multiple processes. For instance, if you have farmed out work to a number of worker processes that run in parallel, you would most likely want to view these timings as if it was one application. By default, the Function list does exactly that. In the Job Scheduler example above we would see the timings of the functions in the Job Scheduler threads across all captures processes. In some cases, however, it may still be convenient see the timings per process, or for a selection of processes. To accomplish this, the thread filter dialog contains a 'group by process' checkbox if the session contains multiple processes:
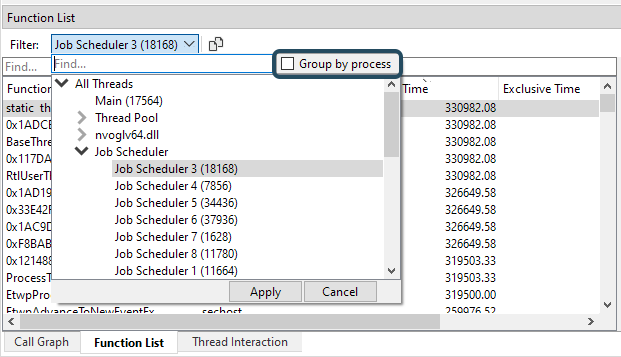
When clicking 'group by process', the thread hierarchy will change so that at the root level the threads are split by process first:
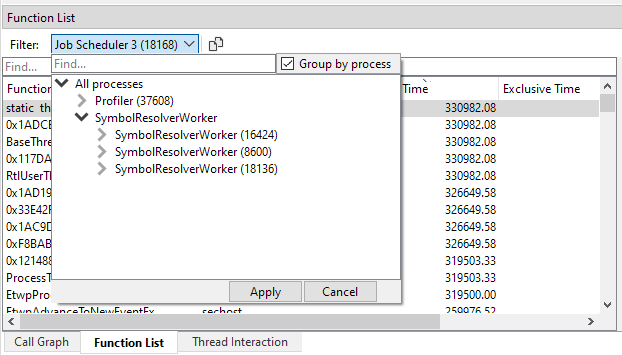
If we select a process node, we will filter the Function list to that process only. If we select threads under the process, we will see only the selected threads for that process. Again, any combination of selections will work, so you can still multi-select and pick the threads you would like to inspect from multiple processes.
An alternative way of filtering data in the Function list view is by clicking on a bar in the threads view. The view is now filtered so that is displays only the selected function and all its children:
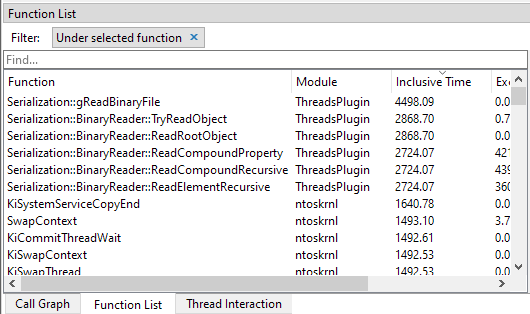
To clear this function filter and return to the thread selection UI, click on the cross icon in the filter.
It is also possible to filter the Function list to a node in the Call Graph, allowing you to see aggregated timings for a branch in the Call Graph. This can be performed by going to the Call Graph, right-clicking a node, and selecting 'Set as root'. This will apply a subfilter to the existing filter, and the filter will carry over to the Function List:

See the Call Graph's Set as root chapter for more information.
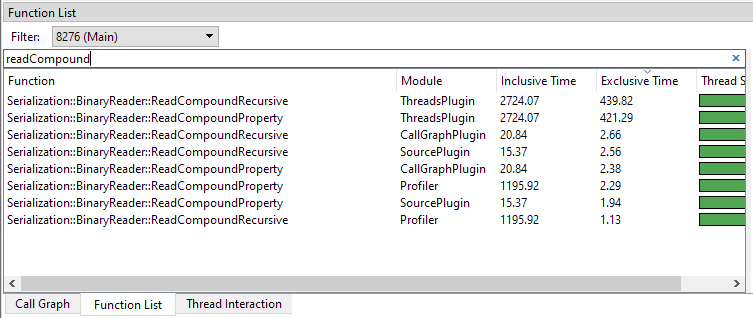
The text box above the list functions as a subfilter as well. In the following image you can see how the list is limited to functions that only contain the 'readCompound' substring:
Calls & Called By views
The Function list also serves as a 'butterfly' view: a view where we can see where the function was called from, and what it calls. Let look at a typical use case:

One of the things that pop out in this example is memcmp. Low-level functions like memcmp are typically called from many different locations and therefore harder to spot in the callgraph. The combined time, however, can be significant as shown in this example. By clicking on an item in the function list, we will update the Source and Disassembly view. The source view will display all the time spent in all invocations of the function within the time range. Also, after an item is clicked, we can find out where the function was called from and what code paths were responsible for what portion of the total time spent. The trees on the right of the list shows the callers ('called by') and callees ('calls'):
- The Called by tree shows what functions called the selected function, and how much time was spent in that code path.
- The Calls tree shows all functions that are being called by the function, and how much time was spent in that code path. Clicking on an item in the Calls tree will also update the Source and Disassembly view.
Double-clicking nodes in the trees will center the function in the function list.
In our example we see that multiple functions like ReadCompoundProperty and GetCompound are responsible for the largest portion of memcmp calls. We can open the subnodes to further investigate the paths leading to these functions.
Context menu & toolbar
When clicking on a function in the Function list, a number of convenience functions are available:

- Copy. Copies all columns from all selected items to the clipboard.
- Copy Advanced. Offers specific ways of copying the selected function to the clipboard.
- Find in Call Graph. Filters the Call Graph to this function.
- View Statistics. Populates the Function Statistics view with information from this function. More info on how the Function Statistics can be automatically populated for each selected node can be found here.
- Show Symbol Info. Displays the Symbol Resolve Diagnostics for the selected function, allowing you to easily diagnose symbol resolving issues.
The Source & Disassembly view
When selecting a function in the CallGraph, Function list or the Thread Interaction view, the Source and Disassembly view is updated to display the function along with timings.

Here you can see how much time was spent, and in what thread states, per source code line. When hovering over the thread state, more timing information is displayed.
If the source file could not be resolved but the image file (DLL, exe) is present on the disk, a disassembly view is displayed. For instance, when clicking on a Windows DLL function, the disassembly is displayed if the signatures of the DLL match and if the process has access to the file. Per-instruction timings will be available:
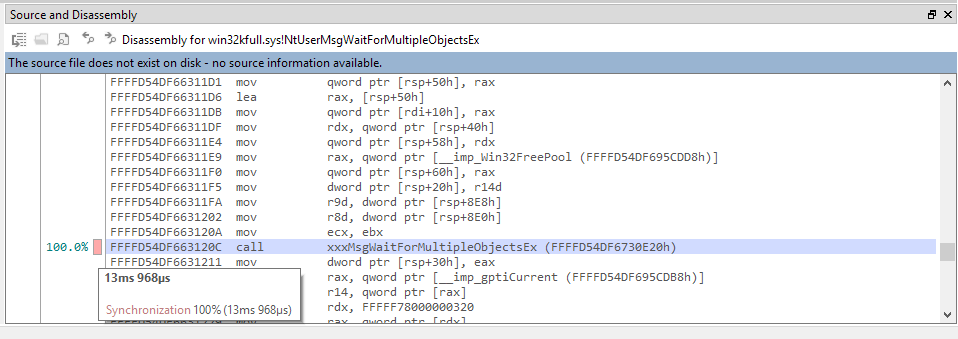
If the source file could be resolved and the image file is present on the disk, mixed-mode disassembly can be displayed by clicking the disassembly icon in the toolbar.

While in the mixed-mode disassembly view, the source lines can be toggled on or off through the view options icon in the toolbar.

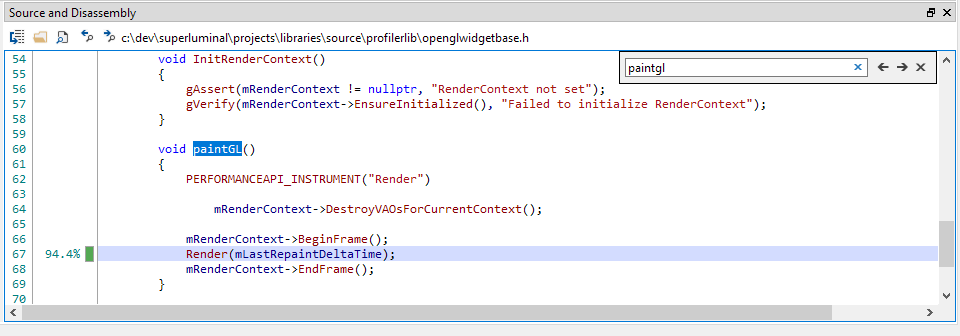
We can find text in the Source and Disassembly view either by pressing CTRL+F, or by clicking the find button in the toolbar. Like traditional Windows applications, F3 and SHIFT+F3 will go the next and previous find results.
To copy the source code including the timing information, you can either press CTRL+SHIFT+C, or use the context menu:
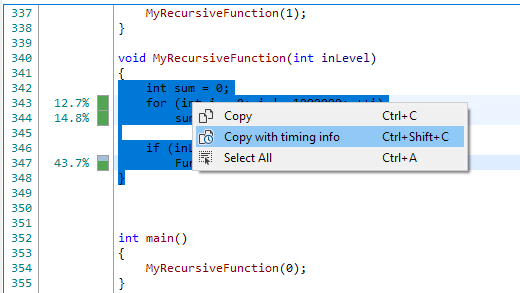
This will copy more verbose timing information to the clipboard:
342 |                        | 	int sum = 0;
343 | 12.66693%  (1ms 133µs) | 	for (int i = 0; i != 1000000; ++i)
344 | 14.77809%  (1ms 322µs) | 		sum += i;
345 |                        |
346 |                        | 	if (inLevel == 0)
347 | 43.66842%  (3ms 907µs) | 		Function0();
348 |                        | }
Symbol Resolve Diagnostics
In order to get actionable data out of a profile, Superluminal needs to be able to resolve code addresses to symbols. This happens completely automatically and, for the most part, no user action is required to correctly resolve symbols. However, in certain cases, such as when opening a profile that was made on another machine, or when your symbol paths haven't been configured yet, symbol resolving might fail for some addresses.
In order to diagnose such symbol resolving issues, Superluminal provides functionality to get detailed information about why the symbol could not be resolved. This diagnostic information can be accessed through the Threads view, the Source view and the Show Modules button in the toolbar.
Threads View
In the Threads view, symbol resolving issues can be diagnosed by right-clicking on an unresolved address and selecting "Show Symbol Info" from the context menu.
For example, in the following screenshot, the address in qwindows.dll could not be resolved to a symbol:
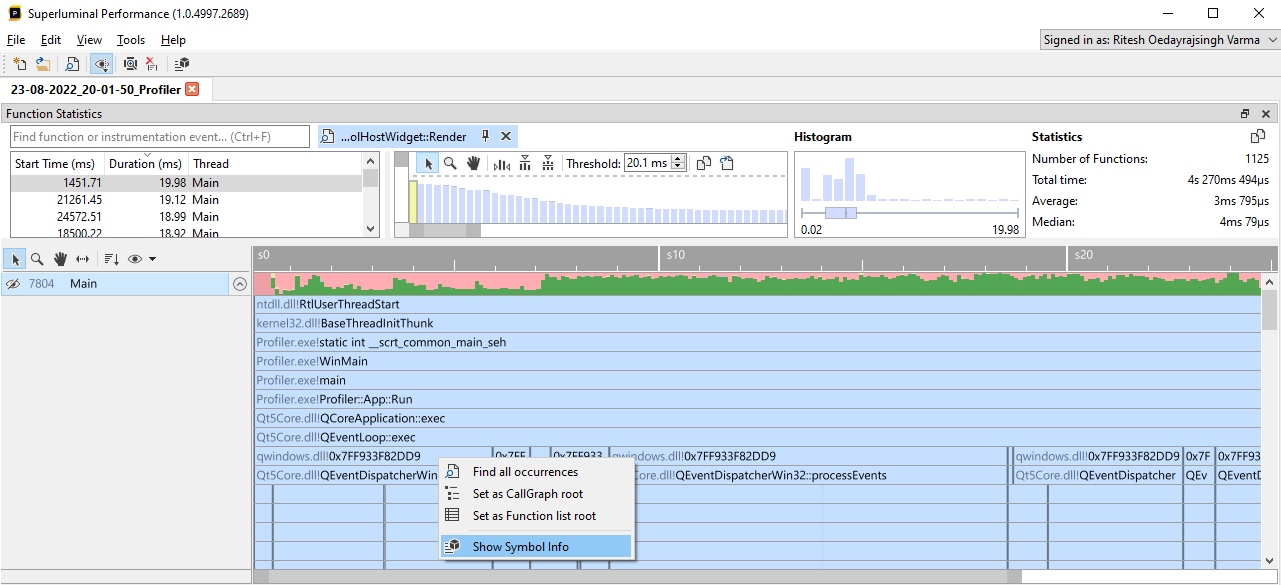
After clicking Show Symbol Info, the Modules window will pop up, which will give you detailed information on why the symbol failed to resolve:

The Modules window consists out of different sections:
- The summary at the top provides high-level information about why the symbol could not be resolved
- The modules list at the left shows all modules that are present in the trace, along with their resolve status
- The pane to the right will provide resolve information about the selected module
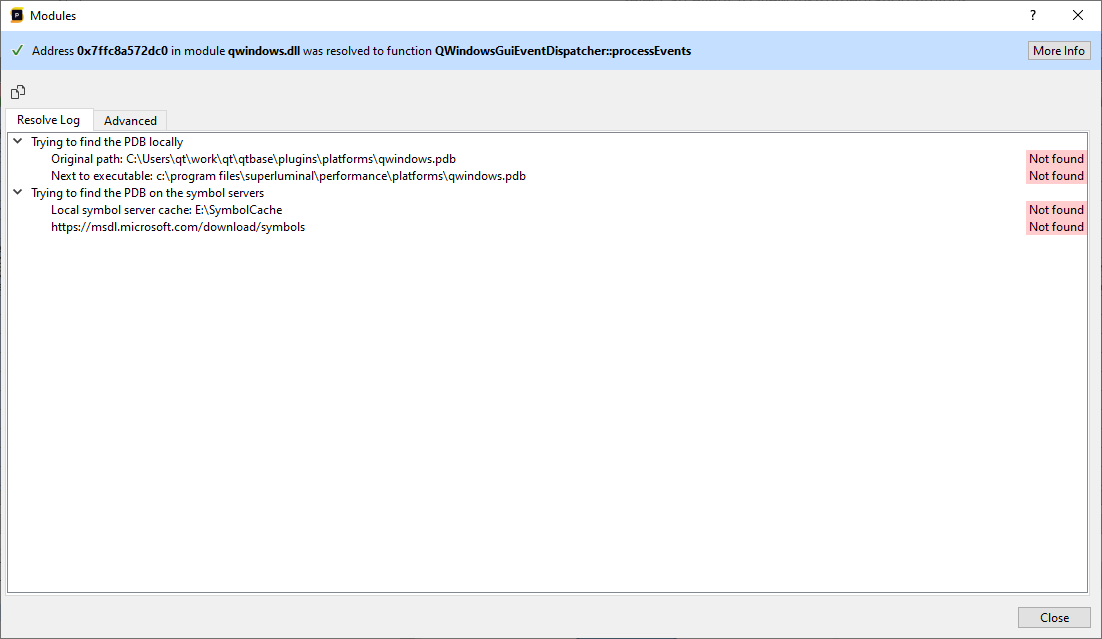
By default, the module for the selected function is already pre-selected for you, but you are free to browse to other modules using the Modules list as well. The Modules list can be filtered on resolve status or name by using the filter UI at the top of the modules list. After selecting a module from the list, the pane to the right will provide information about the locations that Superluminal tried to find the matching symbol file at. For each location, information is displayed about why the symbol file could not be found at that location. The Advanced tab provides detailed information, such as the signature, about which symbol file Superluminal is looking for.
In our case above, qwindows.pdb could not be found at any of the locations Superluminal expected it to be. In this case, we'll need to provide the location that qwindows.pdb can be found at, which can be done by pressing the Settings button in the toolbar in the Modules window and adding a symbol location as described in the Symbol Locations section.
After adding the symbol path, Superluminal will ask whether you want to reprocess in order to resolve any unresolved symbols:
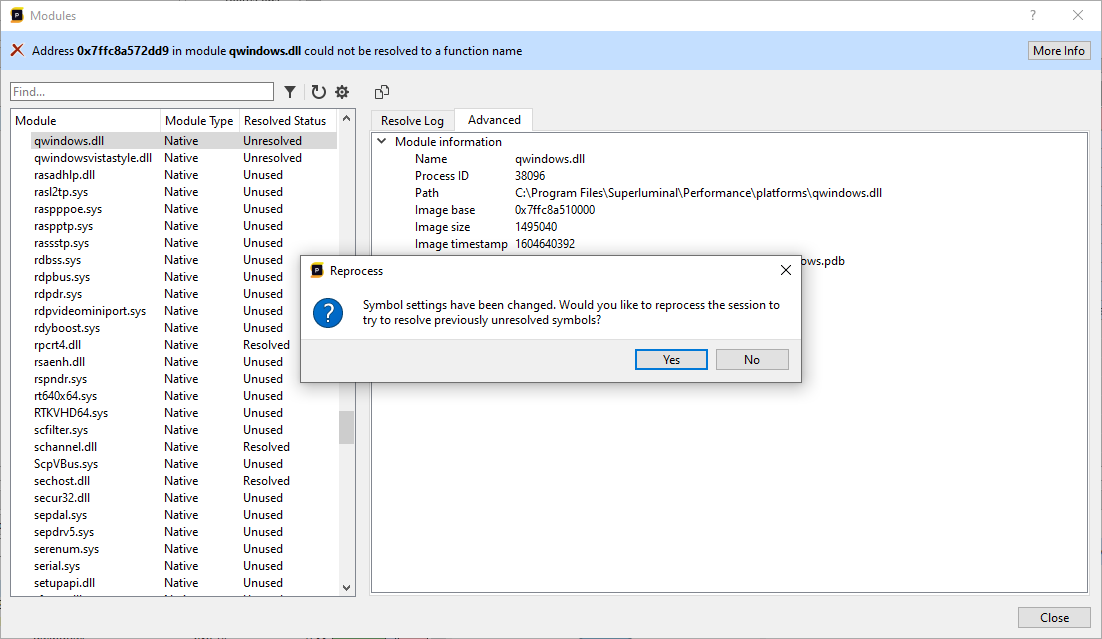
Once the reprocess is complete, the symbol that was unresolved should now be resolved:
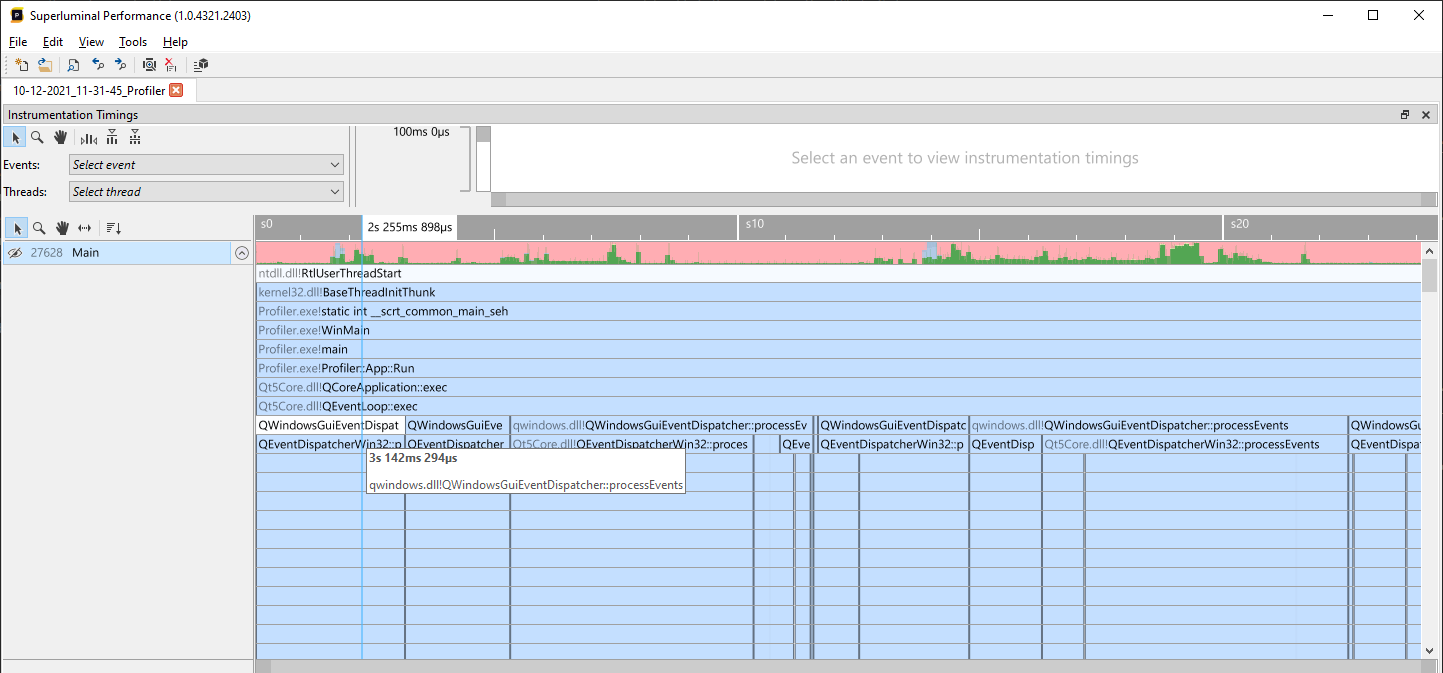
Source View
The Source view will attempt to locate the symbol file when a function is selected in order to display the relevant source file. If the symbol file that contains source information could not be found, an error message will be displayed:
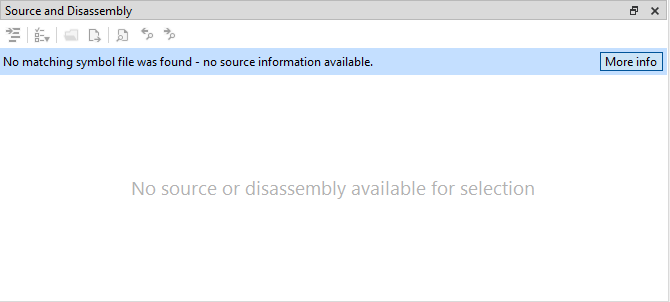
Clicking the More Info button in the error message will show a version of the Modules window (as described in the Threads View section) that only shows the symbol resolve information that's relevant for the source view, and doesn't display the full list of modules. Similar to the version in the Threads view, the Modules window in the Source view will display information on where Superluminal tried to find the symbol file, and why it couldn't be found.
Multi-process support
On Windows it is possible to capture multiple processes at once. If you're working with a capture that contains multiple processes, the different views will contain additional features to manage the captured processes. Looking at different processes on a shared timeline is very helpful, but besides having that visibility, there are a number of very powerful features that really aid in multi-process profiling:
- Process interaction. In the timeline view, it is very easy to see how processes interact with each other through the thread interaction arrows.
- Combined timings accross processes. In the CallGraph, Function List and Source View, it is possible to see the combined costs across processes. For example, if you farmed out work to multiple child processes, it is possible to see the accumulated timings across all these processes instead of just looking at them per process.
See the documentation on the Threads view and the CallGraph view to see how this works in detail.
Selecting processes
To investigate multiple processes, we need to have a Session that contains a selection of processes. If we're attaching to a process, we can simply multi-select processes on the attach screen, and press the Attach button:
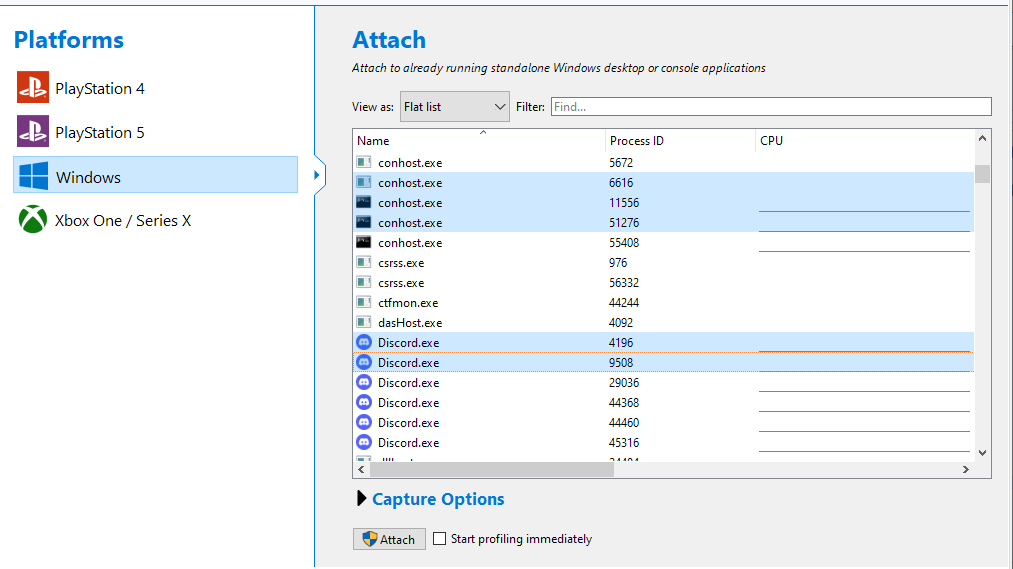
This will include all the selected processes in your session. However, it may be possible that the processes you want to capture are not yet running - they will be spawned later by your process. The way to capture such processes as well is to check the Enable child process profiling checkbox after expanding the Capture Options section:
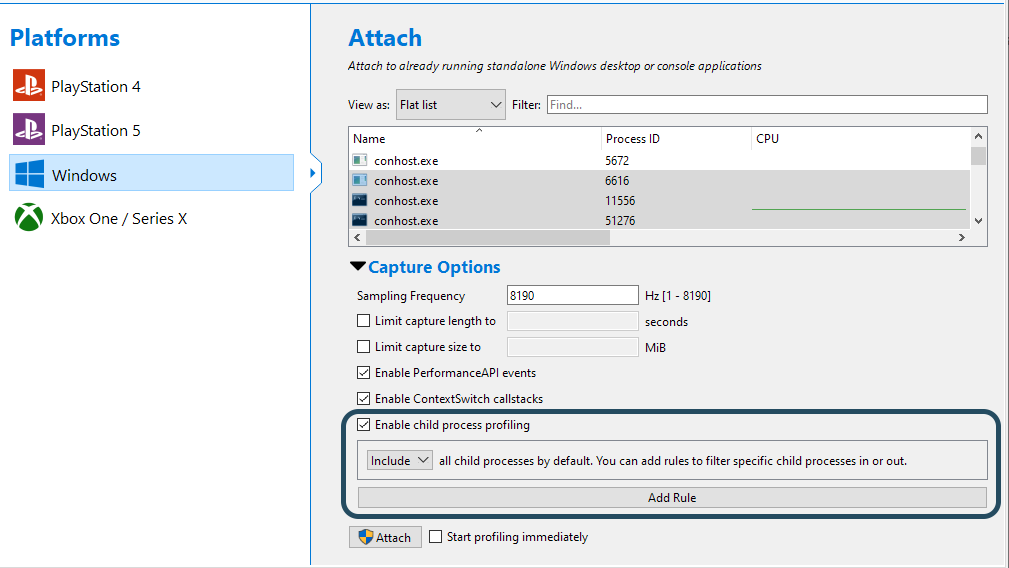
By default, this will capture all child processes that are spawned by any of the processes you selected. This can potentially also include processes that you are not interested in. To have more control over the child processes that are included, it is possible to setup a more detailed ruleset to specify exactly what child processes to include, and what processes to exclude. This is performed by clicking on the Add Rule button. Here is an example of a more sophisticated ruleset that includes and excludes certain processes:

In this example you can see how we're including and excluding processes based on the name of the process, but also on the command-line arguments. Filtering on command-line arguments can be very convenient for processes that can operate in a certain mode and receive the specific task that they should be doing based on command-line arguments. Here are some specifics around the ruleset:
- The process name is required, is an exact match and is case insensitive. The file extension is optional.
- The command-line arguments are optional and case insensitive. Multiple arguments can be separated with a space and can be specified in any order.
In case you are running an executable and not attaching to an already running process, the same child process options are available through the Run dialog's Capture Options.
Adding processes later
It may be possible that you already made a capture and decide that you still want to add processes that were running during the capture, or perhaps remove processes that weren't really of interest. On Windows, it is possible to change these processes after the Session was created. This is accessible by either selecting Edit/Change Processes from the main menu, or by clicking the Change Processes button in the timeline's toolbar:

This will open up a dialog where the left panel displays all the processes that were running during the capture, along with their CPU activity during the time of capture. Any process that is already included will be visible, but greyed out. The right panel displays the processes that are currently included in the Session:
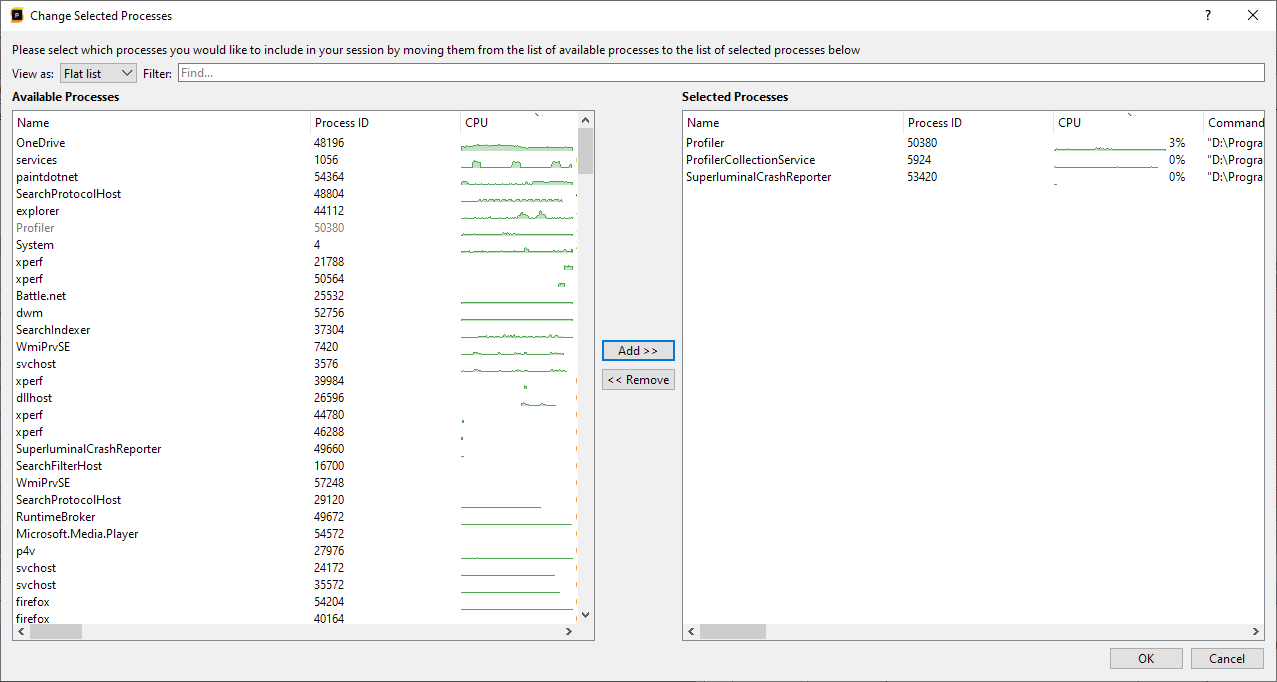
You can add processes by selecting them in the left panel, and then either double-clicking them or pressing the Add button. Once added, they will be visible in the right panel. Similarly, you can select processes in the right panel, and remove them from the current process selection. After pressing OK, the new selection will be applied. The session will need to be reprocessed after a change has been made.
Sometimes it is easier to view the processes as a hierarchy of parent and child processes. By switching to the hierarchy mode, both panels will display the processes in a hierarchical fashion:
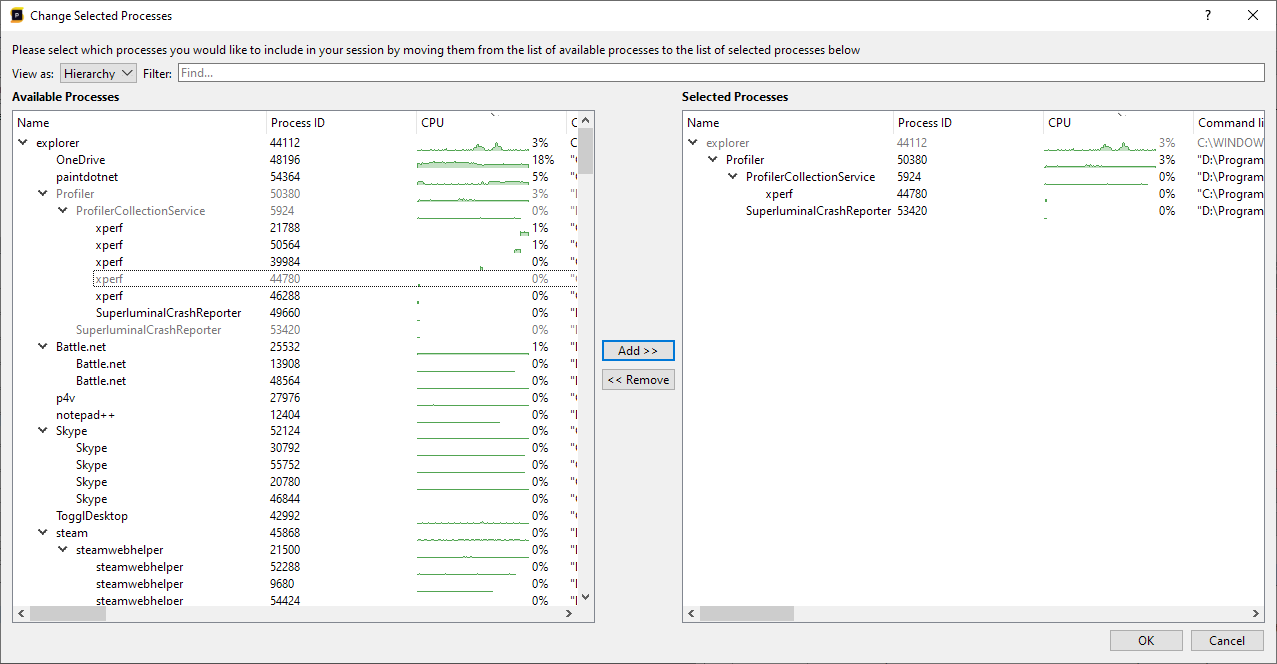
Notice that in the right panel, any parent processes that were part of the hierarchy, but were not included in the selection, are displayed as greyed out items.
Managing sessions & runs
On the 'New session' page, we have the ability to manage your previously recorded sessions through the Session Explorer. We can also manage recently launched applications, so that we can quickly re-launch an application with the same set of parameters.
Session Explorer
When we click on the Session Explorer, we see all the sessions that were previously recorded. By default this acts as a recent file list, because the list is sorted on 'Recently Used'. To open a session, double-click it.
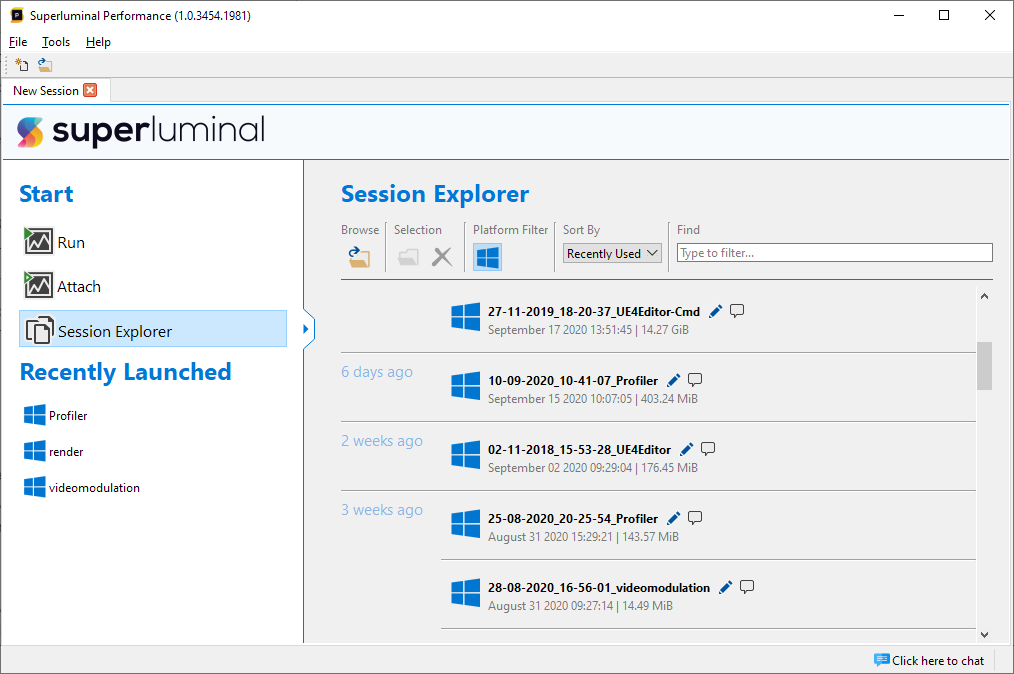
Besides acting as a recent file list, the explorer lets you manage all your sessions. You can rename a session by clicking on the pencil icon for a single session. You can also add annotations to you session, so that you can remember the details surrounding the particular capture. To do so, click the icon with the text balloon to add notes to your session.

If there are files that are not present in your capture folder, but you still want to open them, use the 'Browse' button to open a traditional browse-to-file dialog.
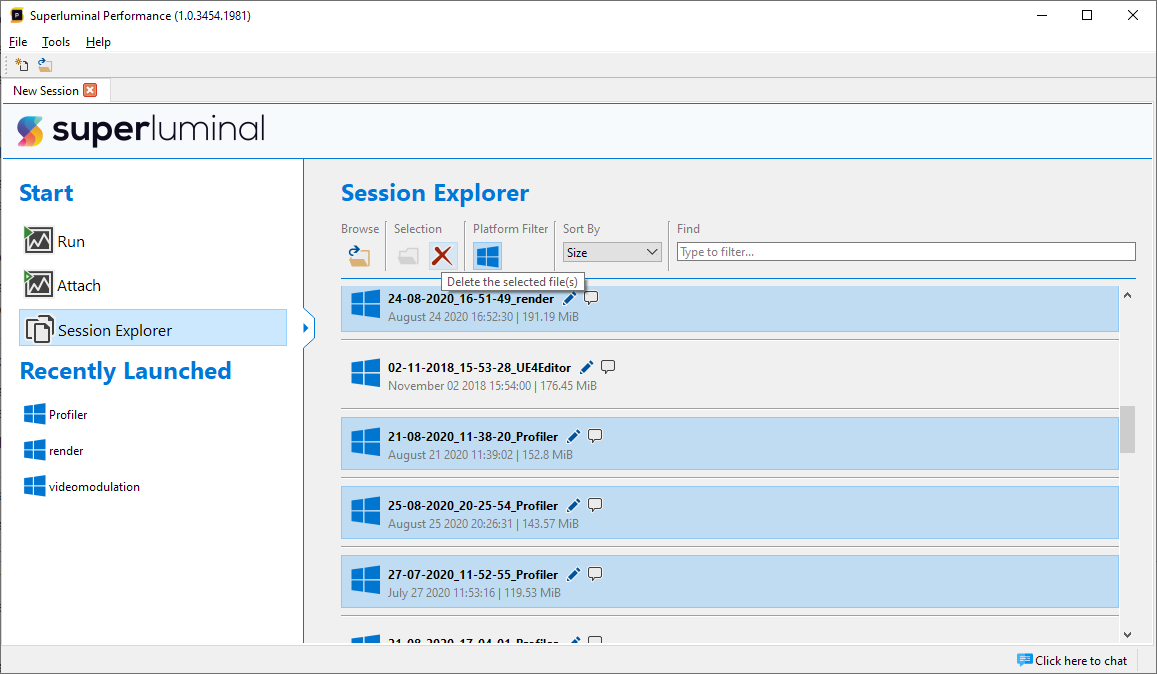
To clean up your captures folder, each session displays the size it uses on disk. You can also sort the entire list of sessions by their size. By holding CTRL or SHIFT while clicking, you can multi-select sessions. If you press DELETE, or click the 'delete' button in the toolbar, you can erase the selected sessions.
Importing & Exporting
Sessions can be shared with other people by exporting them to a package. This package will include all symbols that were already resolved in the session. Exporting a session to a package can be performed by going to the Session Explorer, selecting a session, and then clicking the export button in the toolbar:
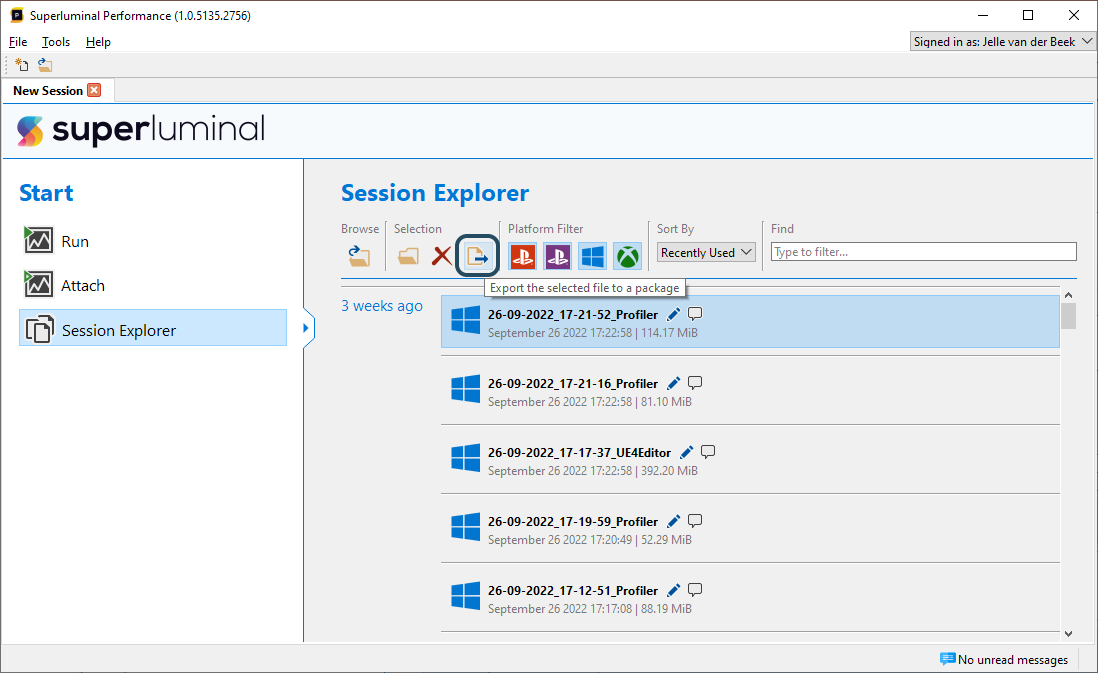
When clicking the 'Export' button, you can select the file name of the package to export to:

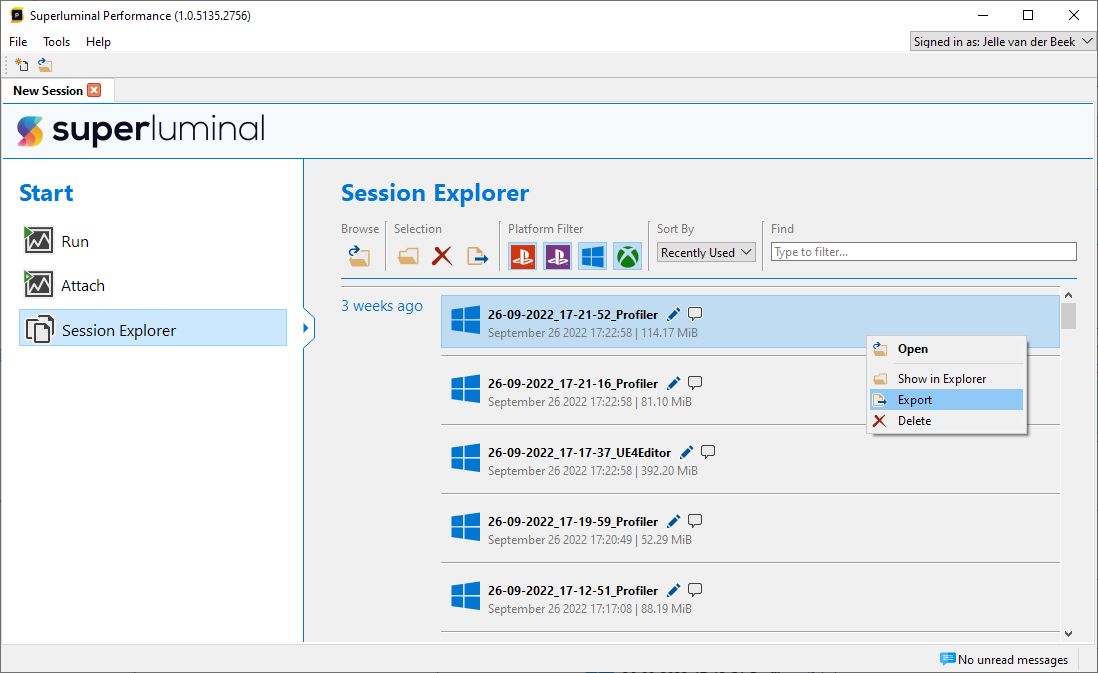
Exporting can also be performed by right-clicking a session in the Session Explorer, and selecting 'Export' through the context menu:
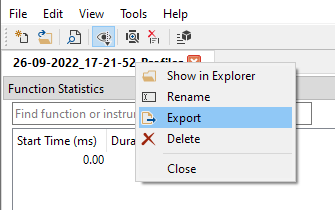
Alternatively, it can also be accessed by right-clicking an open session tab, and selecting 'Export':
To import an existing package, you can browse to it by clicking the 'Browse' button in the Session Explorer:

Alternatively, you can drag and drop the package into the Session Explorer.
If a package is imported, and there is already a session present with that name, the following options will be presented:
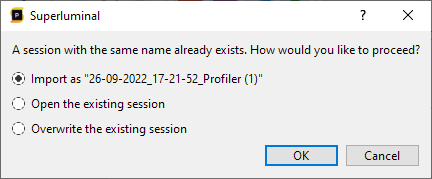
You can continue by choosing one of the following options:
- Import as '...'. This will import the package with a new name, by adding a unique postfix behind it.
- Open the existing session. This will not import the package, but open the session that was already present.
- Overwrite the existing session. This will import the package and overwrite the session that was already present.
Recently launched
Under 'Recently Launched', we see a number of applications that we have profiled earlier. We may have ran an application with different sets of parameters, like different command-line parameters or a different capture frequency. Or perhaps we sometimes run a DEBUG or a RELEASE configuration. To make re-launching of the same application in different configurations easier, we categorize the various runs that you have performed. Click on a recently launched application to see the configurations.
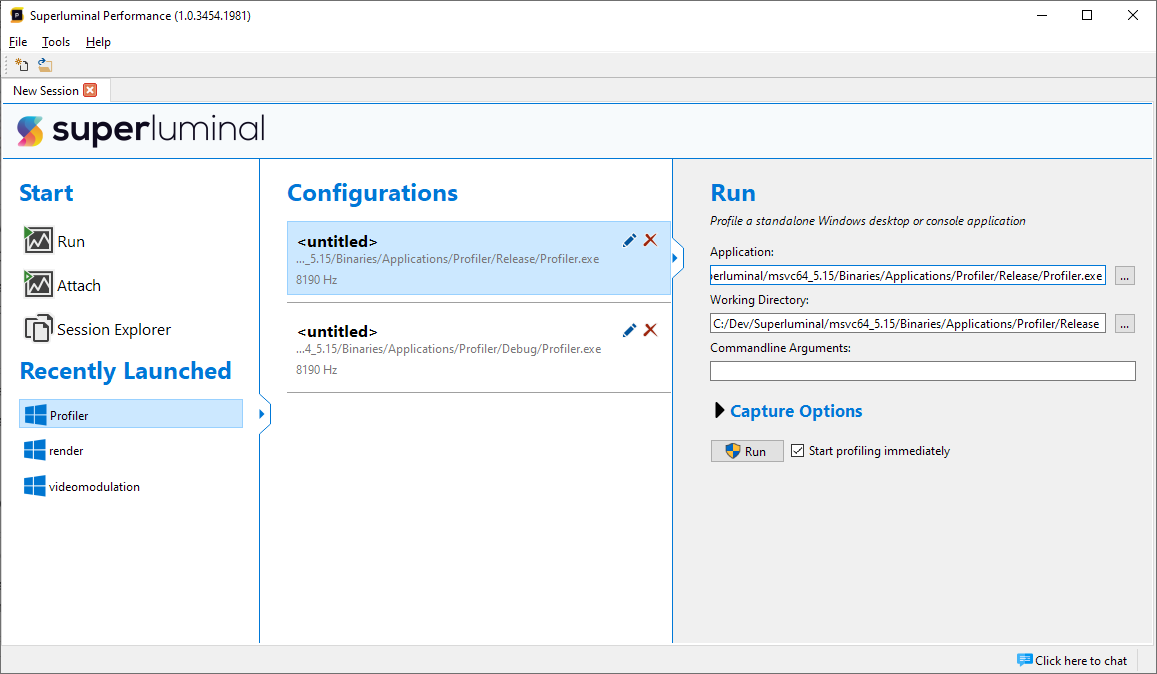
Here we can see two configurations for our 'Profiler' application that we have profiled. We ran both a DEBUG and RELEASE configuration. The differences between the configurations that you have ran are shown for each configuration.
Currently, the configurations are still untitled. To organize your configurations, click on the pencil icon to rename your configurations to a sensible name.
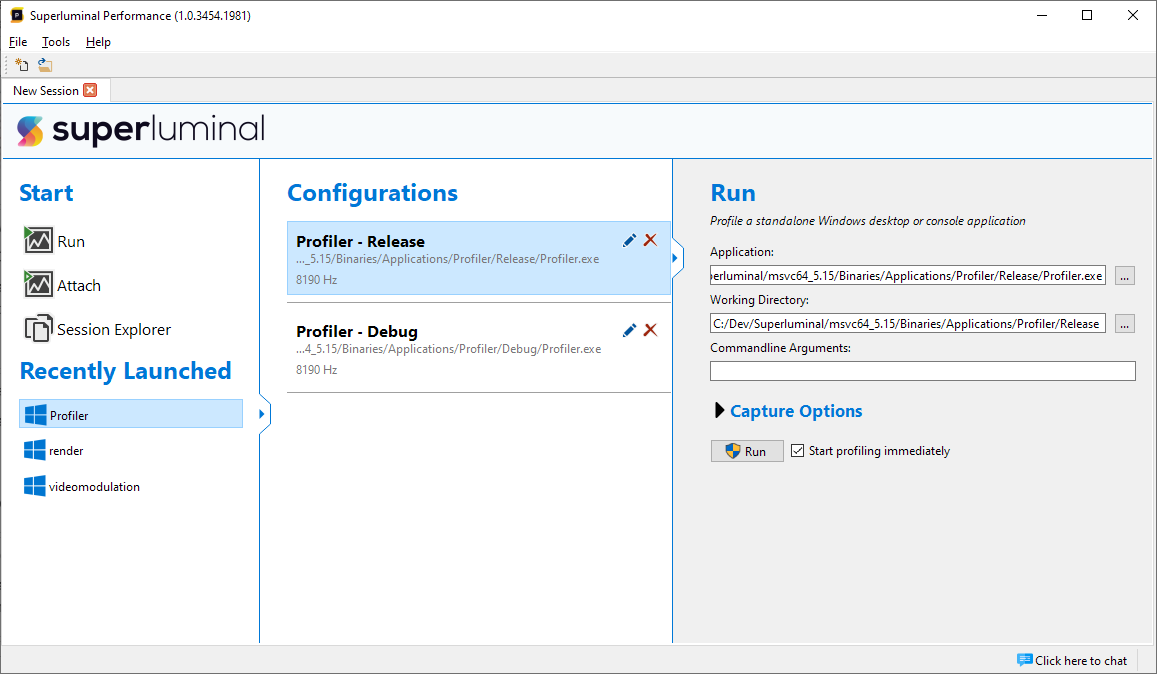
When you click on any of the configurations, the parameters in the configuration will be set in the right panel and you can click 'Run' to launch the application with the set of parameters from the configuration directly.
Using the Performance API
The PerformanceAPI can be used to communicate with Superluminal Performance from the target application. It is used to markup code with instrumentation events and to give names to threads. The API can be used either by statically linking to a library, or by dynamically loading a DLL at runtime.
Static linking
The Performance API (lib and header) is located in the ‘API’ subfolder of the installation directory. The libraries that are provided are compatible with VS2015 (toolset v140) and up. The libraries are shipped in multiple configurations. The filename suffixes describe what configuration is used and reflect the Microsoft compiler flags:
- PerformanceAPI_MD.lib. Release static library with dynamically linked runtime.
- PerformanceAPI_MT.lib. Release static library with statically linked runtime.
- PerformanceAPI_MDd.lib. Debug static library with dynamically linked runtime.
- PerformanceAPI_MTd.lib. Debug static library with statically linked runtime.
- PerformanceAPI_MDd_NoIteratorDebug.lib. Debug static library with dynamically linked runtime, with
_ITERATOR_DEBUG_LEVELset to0. - PerformanceAPI_MTd_NoIteratorDebug.lib. Debug static library with statically linked runtime, with
_ITERATOR_DEBUG_LEVELset to0.
A FindSuperluminalAPI.cmake file is provided that can be used to easily consume the PerformanceAPI from CMake based projects. This module can be used to find the Superluminal API libs & headers via find_package.
For example: find_package(SuperluminalAPI REQUIRED)
You can use it by adding the API directory of your Superluminal install to your CMAKE_PREFIX_PATH, or alternatively by copying the entire API directory to a place of your own choosing and adding that location to CMAKE_PREFIX_PATH.
The following (optional) variables can be set prior to issueing the find_package command:
SuperluminalAPI_ROOTThe root directory where the libs & headers should be found. For example [SuperluminalInstallDir]\API.- If this is not set, the libs & headers are assumed to be next to the location of FindSuperluminalAPI.cmake
SuperluminalAPI_USE_STATIC_RUNTIME- If this is set, the libraries linked to the static C runtime (i.e. /MT and /MTd) will be returned
- If not set, the libraries linked to the dynamic C runtime (i.e. /MD and /MDd) will be returned
On completion of find_package, the following CMake variables will be set:
SuperluminalAPI_FOUNDWhether the package was foundSuperluminalAPI_LIBS_RELEASEThe Release libraries to link againstSuperluminalAPI_LIBS_DEBUGThe Debug libraries to link againstSuperluminalAPI_INCLUDE_DIRSThe include directories to use
In addition, if find_package completed successfully, the target SuperluminalAPI will be defined.
You should prefer to consume this target via target_link_libraries(YOUR_TARGET PRIVATE SuperluminalAPI), rather than by using the above variables directly.
Dynamic library
For cases where linking statically to the PerformanceAPI is not desireable, a dynamic library is also provided. The dynamic library provides the same API as the static library, but does not require linking to a library. The DLL and headers are located in the ‘API’ subfolder of the installation directory. The DLL is intended to be used in the following manner:
- Copy PerformanceAPI_capi.h to your source tree
- Optionally, also copy PerformanceAPI.dll to your project
- Load PerformanceAPI.dll through
LoadLibraryfrom Superluminal's installation directory or the location you copied it to. - Use
GetProcAddressto find thePerformanceAPI_GetAPIfunction exported from the DLL and cast it to thePerformanceAPI_GetAPI_Functype exposed in the PerformanceAPI_capi.h header. - Call the resulting
PerformanceAPI_GetAPIfunction pointer usingPERFORMANCEAPI_VERSIONfor the first argument and a pointer to aPerformanceAPI_Functionsstruct for the second argument.- If successful (i.e. return code is 1), the
PerformanceAPI_Functionsstruct will be filled with function pointers to the API
- If successful (i.e. return code is 1), the
- Use the
PerformanceAPI_Functionsstruct to call API functions as needed.
In code form, a working example of the above is as follows. Note that a helper function, PerformanceAPI_LoadFrom, is also provided in header PerformanceAPI_loader.h that does all this work for you, so this just serves as an example.
// Note: this is just an example; a full working implementation is provided in PerformanceAPI_loader.h
int PerformanceAPI_Load(const wchar_t* inPathToDLL, PerformanceAPI_Functions* outFunctions)
{
    HMODULE module = LoadLibraryW(inPathToDLL);
    if (module == NULL)
        return 0;

    PerformanceAPI_GetAPI_Func getAPI = (PerformanceAPI_GetAPI_Func)((void*)GetProcAddress(module, "PerformanceAPI_GetAPI"));
    if (getAPI == NULL)
    {
        FreeLibrary(module);
        return 0;
    }

    if (getAPI(PERFORMANCEAPI_VERSION, outFunctions) == 0)
    {
        FreeLibrary(module);
        return 0;
    }

    return 1;
}

int main(int _argc, char** _argv)
{
    PerformanceAPI_Functions performanceAPI;

    // Load the API from the default installation path
    if (!PerformanceAPI_Load(L"C:\\Program Files\\Superluminal\\Performance\\API\\dll\\x64\\PerformanceAPI.dll", &functions))
        return -1;

    // Add an instrumentation event
    {
      performanceAPI.BeginEvent("Example Instrumentation", NULL, PERFORMANCEAPI_DEFAULT_COLOR);
      // ... some long running code here ...
      performanceAPI.EndEvent();
    }

    return 0;
}
.NET
Superluminal has support for profiling .NET programs. If you wish to use the API from a .NET-based language such as C#, you can use the SuperluminalPerf NuGet package, which was kindly provided by Alexandre Mutel. Please see the GitHub page for more information on how to install & use it.
Instrumentation
To send instrumentation data to Superluminal, two mechanisms are provided:
- The
InstrumentationScopeclass. This class will signal the start of a scope in its constructor and signal the end of the scope in its destructor. InstrumentationScopes can be freely nested. - The
PerformanceAPI_*free functions.- These functions are designed for integration with existing profiling systems that, for example, already define their own scope-based profiling classes. Note: calls to the
PerformanceAPI_BeginEvent/PerformanceAPI_EndEventfunctions must be within the same function. For example, it is not allowed to callPerformanceAPI_BeginEventin functionFooandPerformanceAPI_EndEventin functionBar. - Additional overloads with postfix
_Nare provided that can be used with strings that are not null-terminated. - This is a C API to ease integration with other programming languages.
- These functions are designed for integration with existing profiling systems that, for example, already define their own scope-based profiling classes. Note: calls to the
When sending an instrumentation event through either of these mechanisms, two pieces of data can be provided:
- The event ID (required). This must be a static string (e.g. a regular C string literal). It is used to distinguish events in the UI and is displayed in all views (Instrumentation Chart, Timeline, CallGraph). It is important that the ID of a particular scope remains the same over the lifetime of the program: it is not allowed to use a string that changes for every invocation of the function/scope. Some examples of IDs: the name of a function ("Game::Update"), the operation being performed ("ReadFile").
- The event Data (optional): This must be a string that is either dynamically allocated or a regular string literal. You are free to put whatever data you want in the string; there are no restrictions. The data is also free to change over the lifetime of the program. The intent of the data string is to include data in the event that can differ per instance. This data is displayed in the Instrumentation Chart and Timeline for each single instrumentation event. Some examples of Data strings: the current frame number (for "Game::Update"), the path of the file being read (for "ReadFile").
All const char* arguments in the API are assumed to be UTF8 encoded strings (i.e. non-ASCII chars are fully supported).
To completely disable the API, you can define PERFORMANCEAPI_ENABLED to 0 prior to including PerformanceAPI.h. This macro will cause all functions to be compiled out and the PERFORMANCEAPI_INSTRUMENT_* macros to be empty.
Fiber support
To make sure that instrumentation can work with fibers, the instrumentation API needs to know two things:
- When a fiber starts and stops running through the use of
PerformanceAPI_RegisterFiberandPerformanceAPI_UnregisterFiber - When a fiber switch occurs. The fiber switch needs to be surrounded by calls to
PerformanceAPI_BeginFiberSwitchandPerformanceAPI_EndFiberSwitch.
For example:
void fiberFunc()
{
	uint64_t currentFiber = (uint64_t)GetCurrentFiber();

	// When the fiber starts running, register it
	PerformanceAPI_RegisterFiber(currentFiber);

	// ...do Fiber work here...

	// Wrap the call to SwitchToFiber in Begin/End calls
	PerformanceAPI_BeginFiberSwitch(currentFiber, (uint64_t)someOtherFiber);
	SwitchToFiber(someOtherFiber);
	PerformanceAPI_EndFiberSwitch(currentFiber);

	// ...do more Fiber work here...

	// When fiber stops running, unregister it
	PerformanceAPI_UnregisterFiber(currentFiber);
}
Thread names
Thread names can be visualized in the profiler. If you are already using the Windows SetThreadDescription API, the names will automatically appear in the profiler. Note however, that this function is only available starting with Windows 10, build 1607 (Anniversary Update). The Performance API also has a function to set thread names. It will use SetThreadDescription internally when available, but falls back to a custom method that will send the names to the profiler manually. To use it, call PerformanceAPI_SetCurrentThreadName for the currently active thread.
Example
The following is a fully-functional example of how the API can be used to instrument your code and set thread names. For brevity, it assumes usage of the static library, but equivalent functionality can be achieved with the DLL interface.
#include "PerformanceAPI/PerformanceAPI.h"
#include <thread>
#include <chrono>

void MacroInstrumentedFunction()
{
    PERFORMANCEAPI_INSTRUMENT_FUNCTION();
    std::this_thread::sleep_for(std::chrono::milliseconds(16));

    {
        PERFORMANCEAPI_INSTRUMENT_DATA("Nested scope with contextual data", "");
        std::this_thread::sleep_for(std::chrono::milliseconds(16));
    }

    {
        PERFORMANCEAPI_INSTRUMENT_COLOR("Nested scope with color", PERFORMANCEAPI_MAKE_COLOR(255, 0, 0));
        std::this_thread::sleep_for(std::chrono::milliseconds(16));
    }
}

int main(int _argc, char** _argv)
{
  PerformanceAPI_SetCurrentThreadName("Main");

  {
      PerformanceAPI_BeginEvent("Pass 1", nullptr, PERFORMANCEAPI_DEFAULT_COLOR);
      for (int i = 0; i < 5; ++i)
      {
          MacroInstrumentedFunction();
      }
      PerformanceAPI_EndEvent();
  }

  {
      PerformanceAPI_BeginEvent("Pass 2", nullptr, PERFORMANCEAPI_DEFAULT_COLOR);
      for (int i = 0; i < 5; ++i)
      {
          MacroInstrumentedFunction();
      }
      PerformanceAPI_EndEvent();
  }

  return 0;
}
When the above example program is profiled with Superluminal, it will result in a profile that looks something like the following:
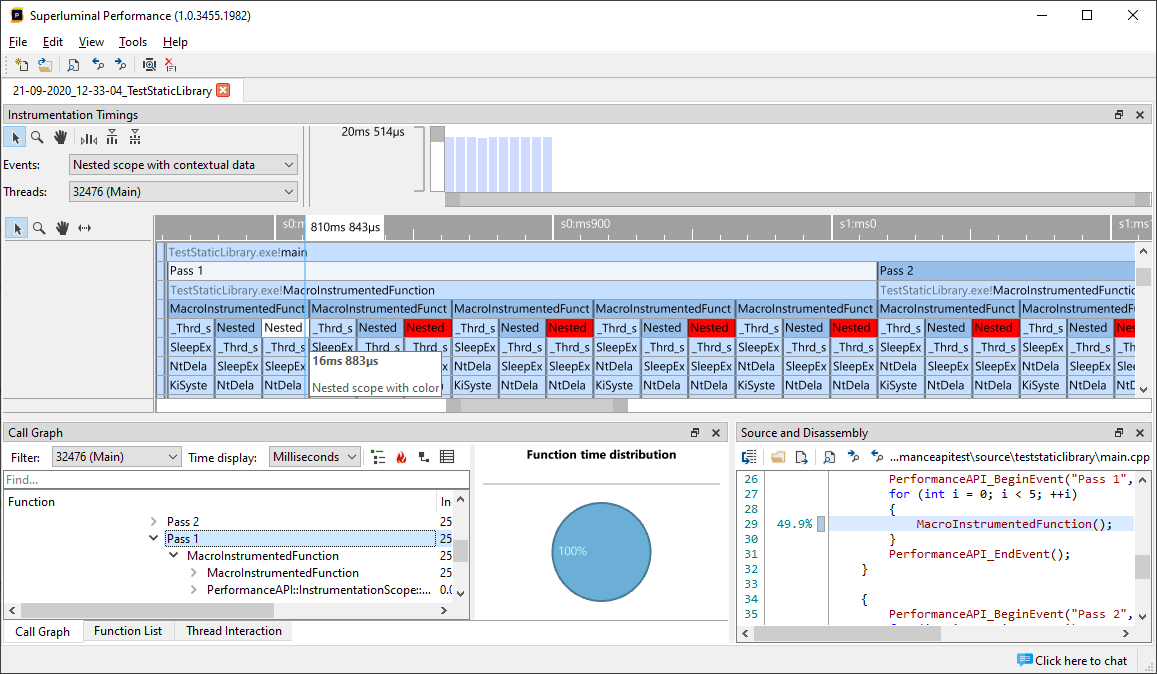
Symbol resolving
In order to resolve symbols, the application you're profiling must be configured correctly. In addition, Superluminal Performance can be configured to retrieve symbols and source files from symbol and source servers, respectively.
Compiler & Linker settings
The following is a list of compiler & linker settings that need to be enabled in the configuration properties of the application (and related modules) you're profiling, in order to be able to correctly resolve symbols.
- Compiler
- C/C++ -> General -> Debug Information Format
- C7 compatible (/Z7) or
- Program Database (/Zi)
- C/C++ -> General -> Debug Information Format
- Linker
- VS2015 and earlier:
- Linker -> Debugging -> Generate Debug Info -> Yes (/DEBUG)
- VS2017 and newer:
- Linker -> Debugging -> Generate Debug Info -> Generate Debug Information optimized for sharing and publishing (/DEBUG:FULL)
- VS2015 and earlier:
Symbol locations
You can add or edit locations that should be searched when symbol (*.pdb) or image files (*.exe, *.dll) are needed during symbol resolving by going to the Tools/Settings menu and selecting the 'General' tab.
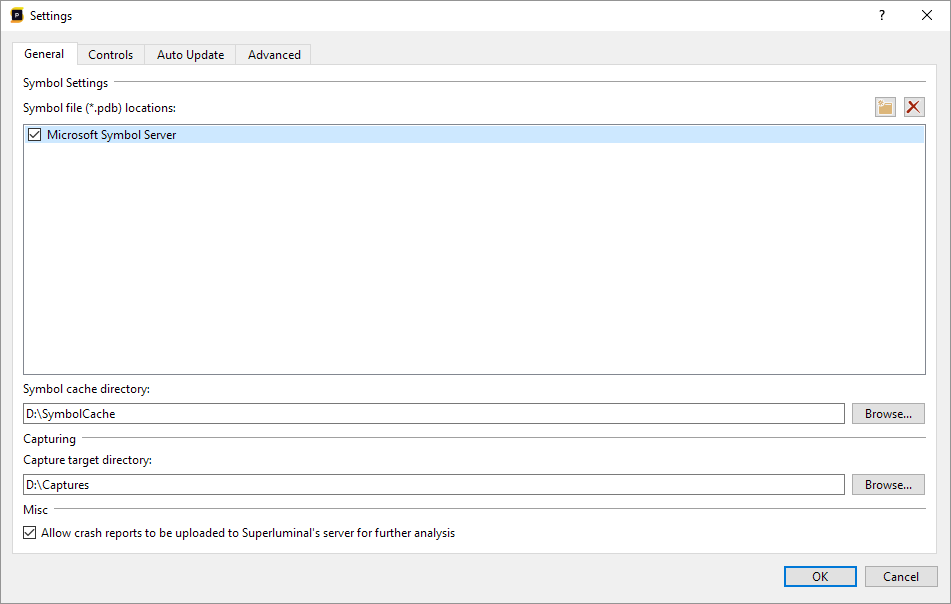
An arbitrary number of symbol locations can be added. Do keep in mind that a large number of symbol locations may slow down the symbol resolving process, as each location must be tried for any unmatched symbol or image file. When symbol & image files are retrieved from symbol locations, they are cached in the Symbol Cache directory, which can also be edited through the Settings menu. It is recommended to place the Symbol Cache directory on a drive with sufficient space, as it may grow quite large.
Finally, there are two ‘types’ of symbol locations that can be specified: symbol servers and local directories.
Symbol Servers
A Symbol Server is nothing more than a directory with a structure as produced by Microsoft’s SymStore tool. The Symbol Server can be accessed as a local directory, over HTTP(S), or through a network share. For example, the following are all valid Symbol Server locations:
- https://msdl.microsoft.com/download/symbols
- D:\Symbols
- \\SomeNetworkShare\Symbols
Local directories & Network shares
A local directory or network share can be used to load symbols, even if it's not in the Symbol Store format. These directories should contain flat lists of PDBs and/or image files. Symbols or image files in this directory will only be used if they match the signature of the required PDB/image.
Source Server / Source Indexing
If your PDBs are correctly source indexed, Superluminal will retrieve source files through your source server when required by the Source view. Superluminal supports both regular source servers (i.e. retrieved through source control such as Perforce) and HTTP(S)-based source servers.
See the Windows documentation for more information about source indexing.
Faster PDB parsing (experimental)
To speed up symbol resolving, we are including a new, experimental PDB parser with Superluminal. It is not yet enabled by default, but you can enable it by going to Tools/Setting/Advanced, and then enabling the 'Use new PDB parser' feature:
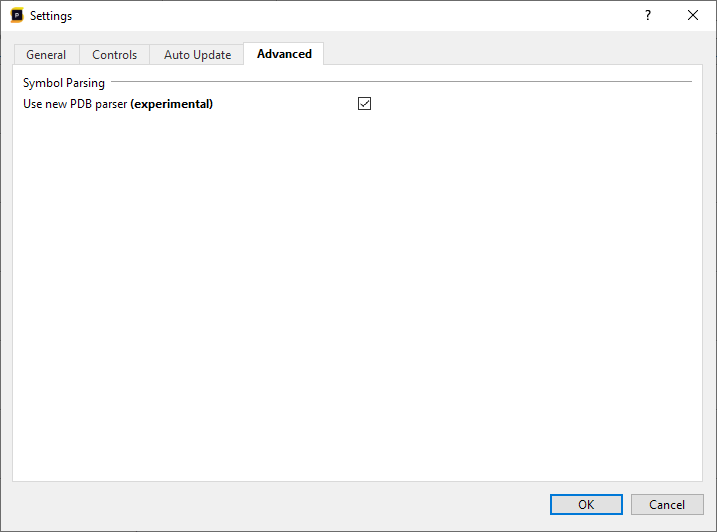
This will speed up the processing of traces significantly. As this is still an experimental feature, please contact us if you're running into issues.
Auto Update
When the application is launched, an update check is performed to see if there are new versions available. This happens at most once a day. To manually search for updates, you can select 'Help/Check for updates' from the main menu. It is also possible to change the auto update settings by selecting Tool/Settings, and then selecting the 'Auto Update' tab:
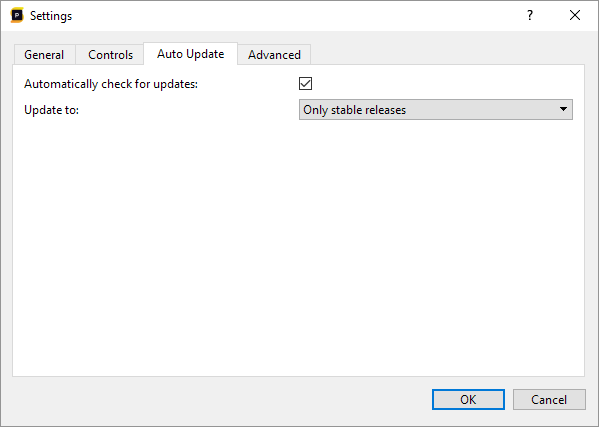
You can disable automatic updates here. Early adoptors can also opt-in for the Insider releases. Those releases contain the latest features that have not been tested as extensively as the stable builds.
In case you want to switch back to a previous stable release of Superluminal, go to our downloads page. Any previous release can just be downloaded and installed over a newer release.
Unity support
Unity applications make use of the Mono runtime to provide scripting capabilities through managed code (C#). Superluminal has full support for profiling Unity applications (both the Editor and Player builds) and will show you both managed and native code in all views, similar to when you're profiling any .NET application.
Supported versions
In order to resolve managed code, Superluminal requires functionality that was introduced in specific Unity versions. The list of supported Unity versions is as follows:
- 2019.4.23 and higher 2019 versions
- 2020.3.2f1 and higher 2020 versions
- 2021.2.1f1 and higher 2021 versions
- 2022.1.0a15 and higher 2022 versions
- All versions from 2023.1.0f1 and higher
Supported platforms
Superluminal is capable of profiling Unity applications on the Windows, Xbox One®, Xbox Series X®, PlayStation®4 and PlayStation®5 platforms.
- To view PlayStation 4 documentation, click here.
- To view PlayStation 5 documentation, click here.
- To view Xbox One or Xbox Series X documentation, click here.
Running Unity applications
Running a Unity application works exactly the same way as running any other application: you simply enter the path to your executable in the Run dialog and press the Run button. Superluminal will automatically detect that you're profiling a Unity application and configure it appropriately in order to be able to resolve managed code.
For more information on running an application, see Starting a new profiling session.
Attaching to a Unity application
In order for managed code to be resolved when attaching to a Unity application, you'll need to make sure that our Unity profiler plugin is located next to your Unity executable (either Editor or Player) and that it was started with the correct command-line arguments. To do so:
- Copy
mono-profiler-superluminal.dllfrom the 'Unity' subdirectory of Superluminal's installation directory to the directory your Unity executable is located in - Start your Unity executable with the following command-line argument (note: this argument is case sensitive):
-monoProfiler superluminal
For more information on attaching to an application, see Starting a new profiling session.
Third party software
Superluminal Performance uses various third party software. To view a list of all used third party software and their licenses, please select Help/About from the main menu.