
C++, meet Superluminal
Superluminal is the new industry-standard profiling tool.
With full support for C++, you can push your performance optimizations to the next level!

First-class support for C++
Symbol Resolving
With full support for C++ symbol resolving and name demangling, the call stacks in your C++ profiles will always be human-readable.
It doesn’t matter if you’re using MSVC or Clang to build your C++ code — both are fully supported.
Syntax Highlighting
The source view has full support for highlighting C++ code, based on the Visual Studio color scheme.
Powerful features like line- and instruction-level timings allow you easily to drill down, so you can see exactly where your C++ program is spending its time.

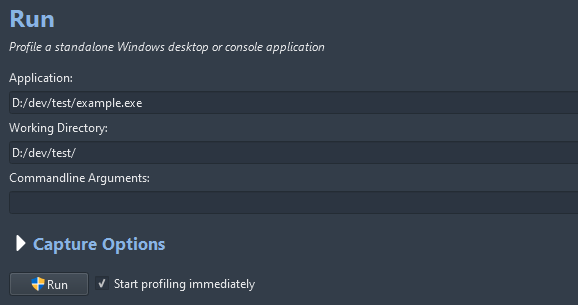
Ready, set, go!
Getting started is easy. Simply install Superluminal and run or attach to your C++ program directly from Superluminal. No code modifications needed.
If you need it, we provide an optional API that can be used to further annotate your C++ program with events that are interesting to you.
And many more features
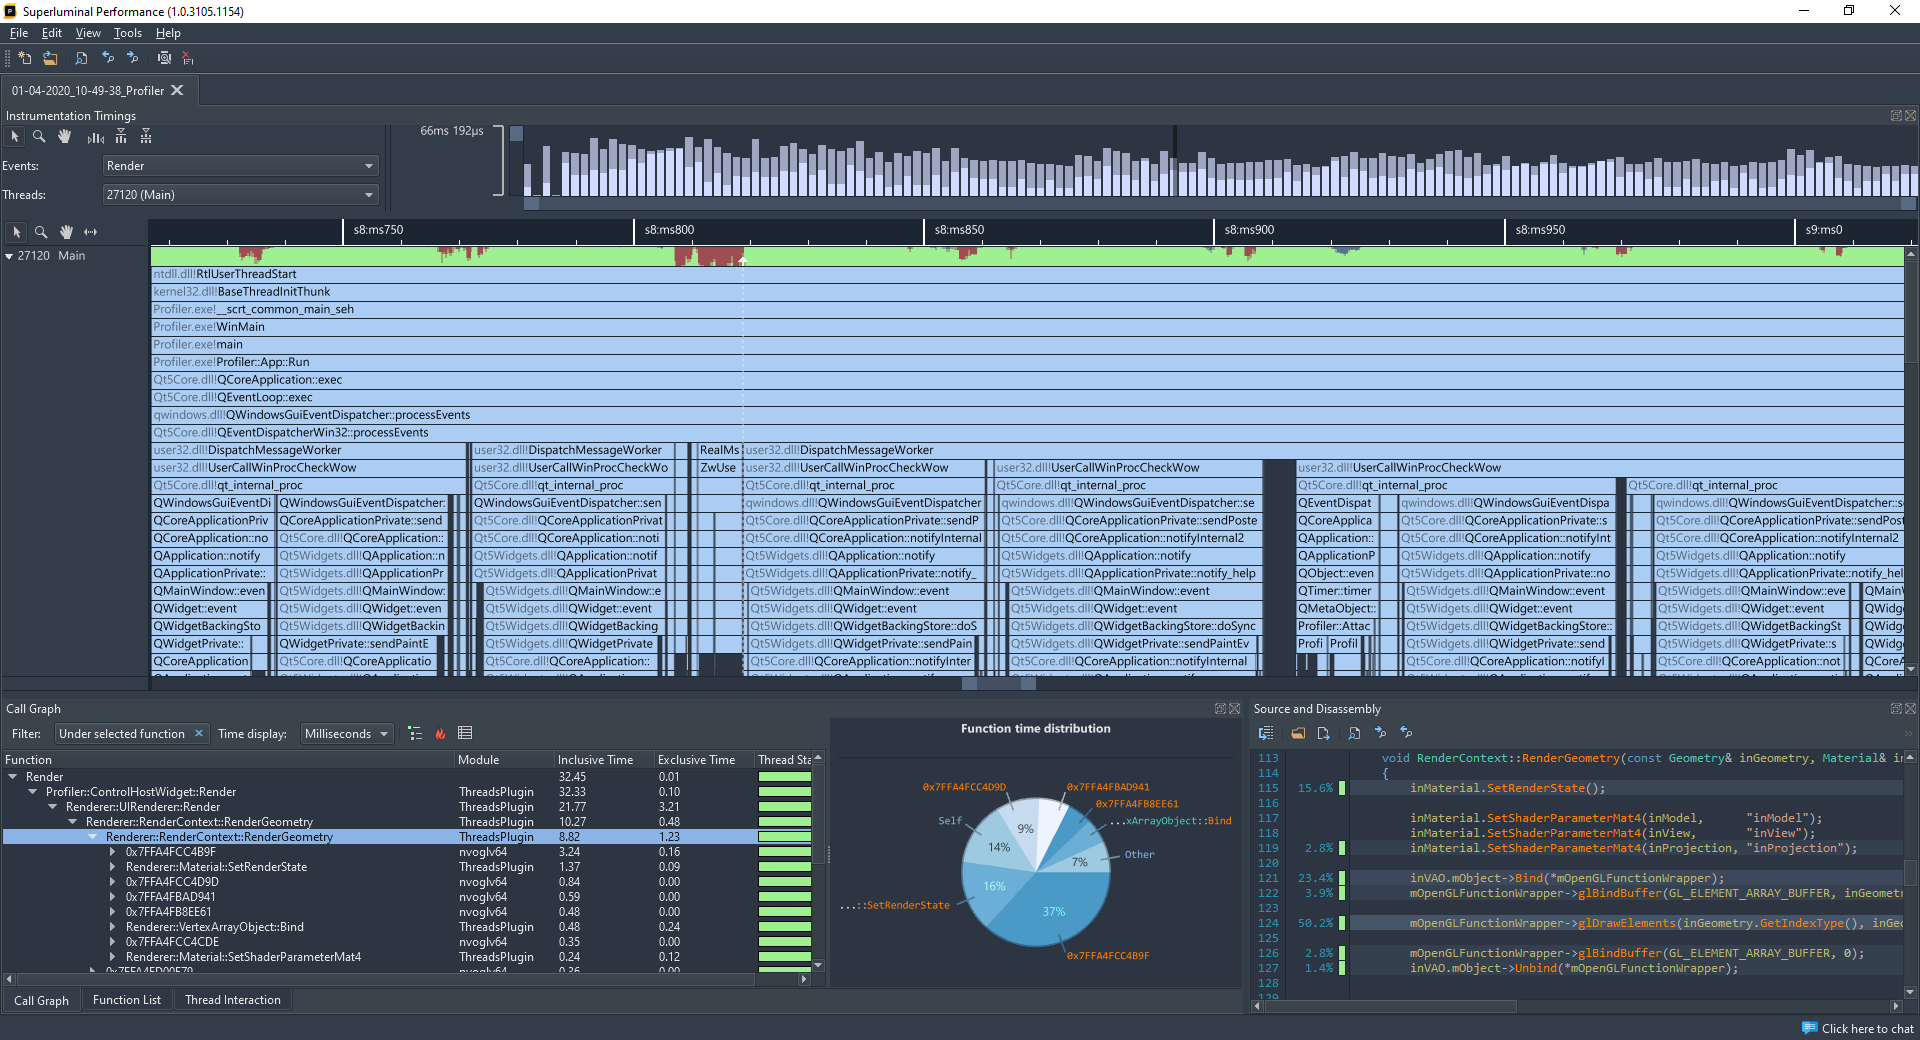
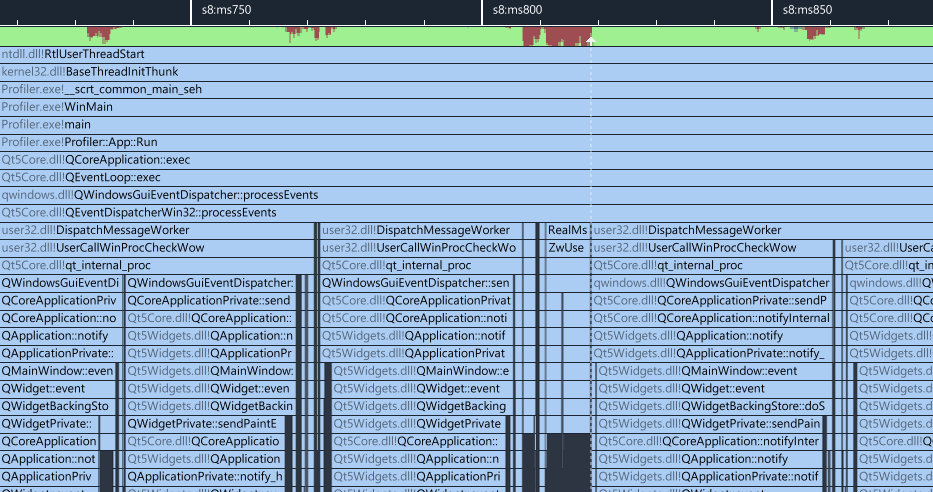
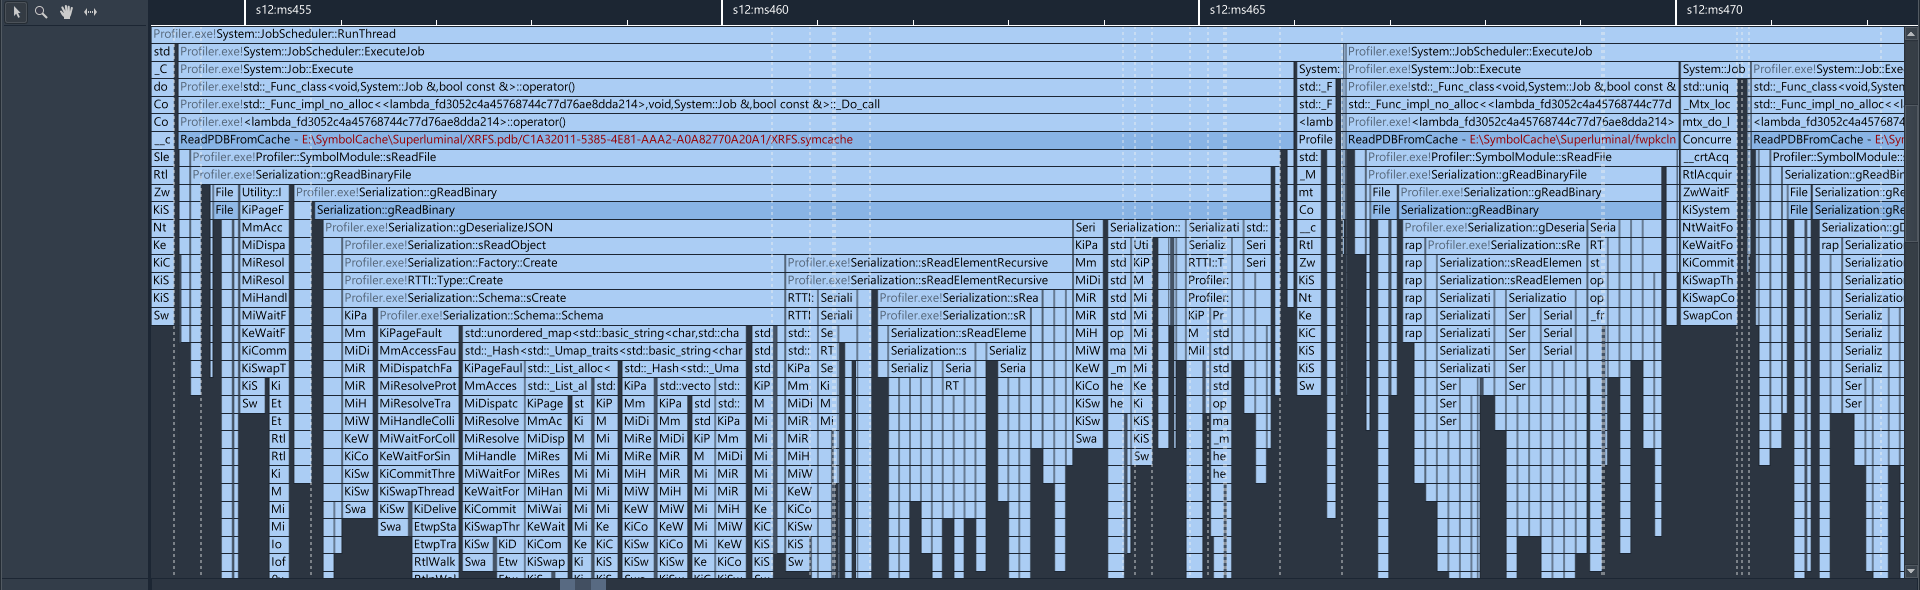
Visual UI
Superluminal is the only sampling profiler that displays the profiling data in a visual UI. Sampling data is displayed on a per-thread timeline, which allows you to see exactly what function is being called when, in what order, and what other functions are being called around it.
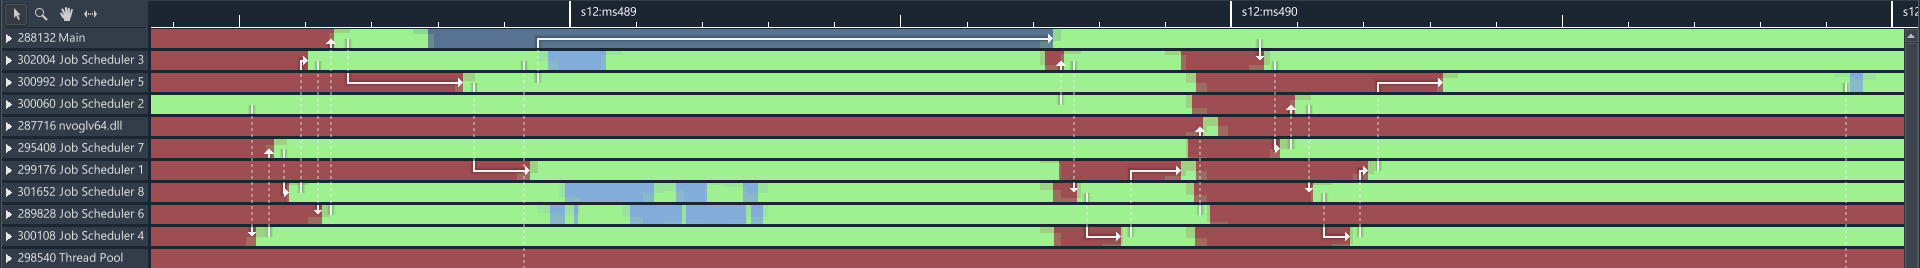
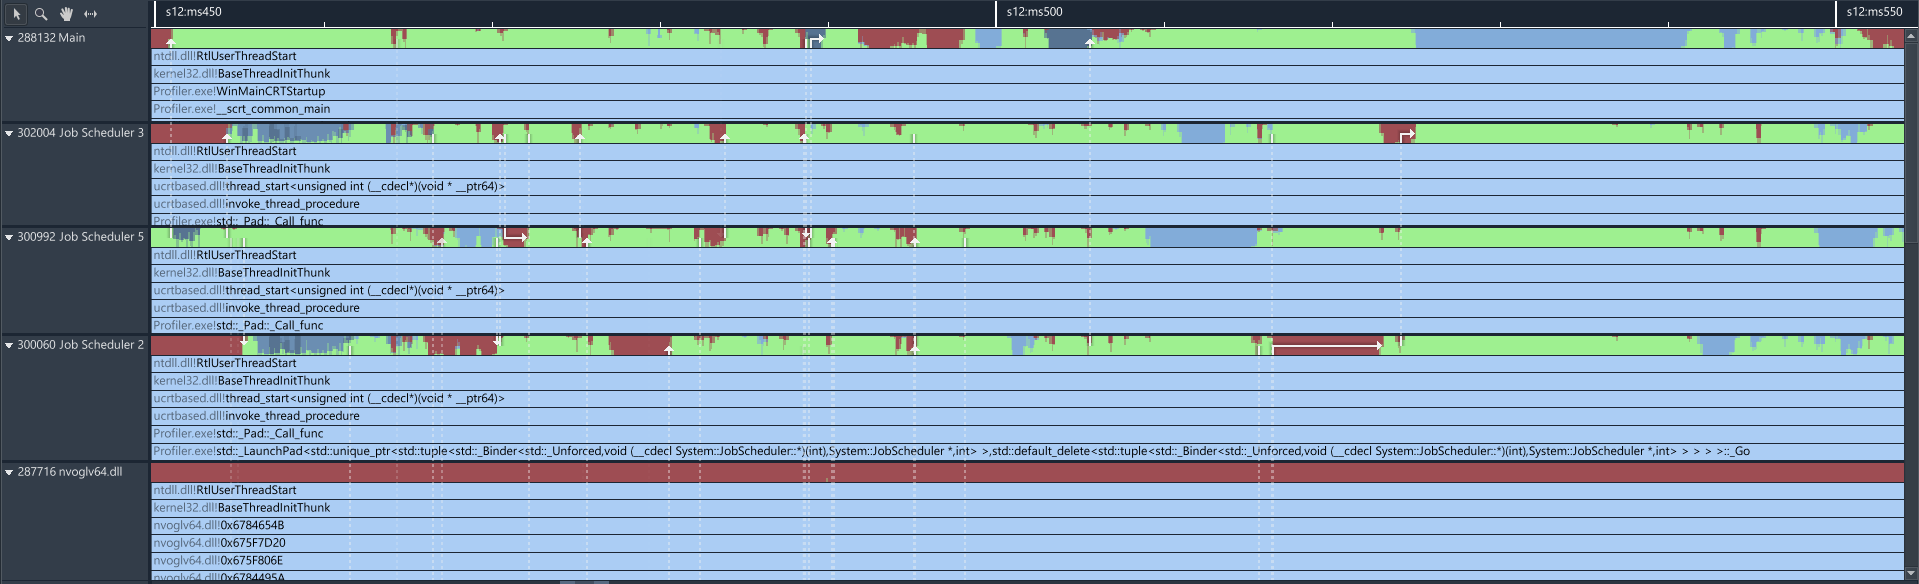
Multithreading Analysis
Understanding the complex interactions between threads in a program can be key in resolving performance issues. These complex interactions are visualized in an intuitive interactive interface that allows you to inspect blocking and unblocking callstacks and easily navigate between them.
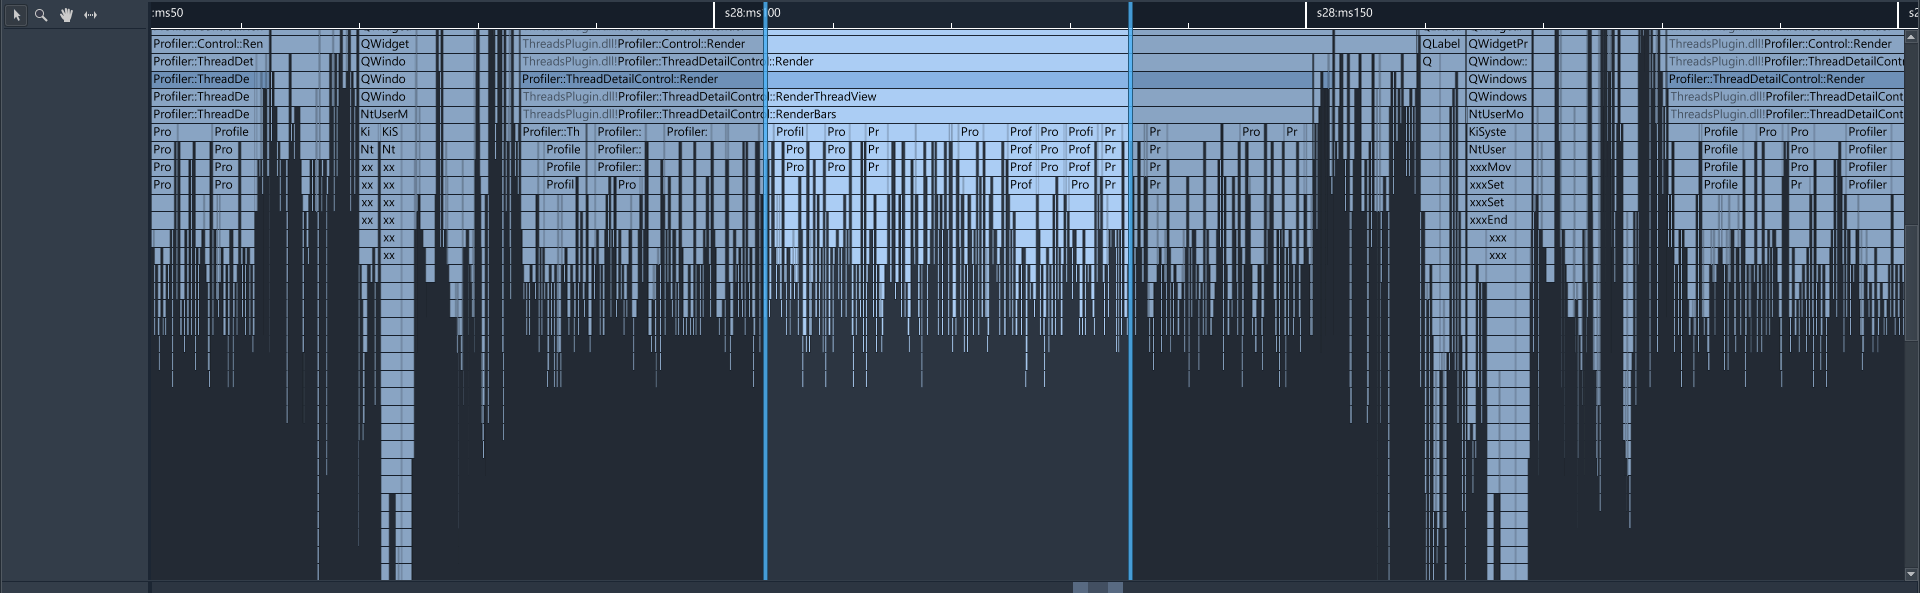
High Frequency Sampling
High frequency sampling (8 – 40 kHz, depending on platform) allows you to hit the ground running without the need to make any code modifications. Sampling can start right from the start of the application, allowing you to inspect application startup, including DLL loading, the static initialization phase and more.
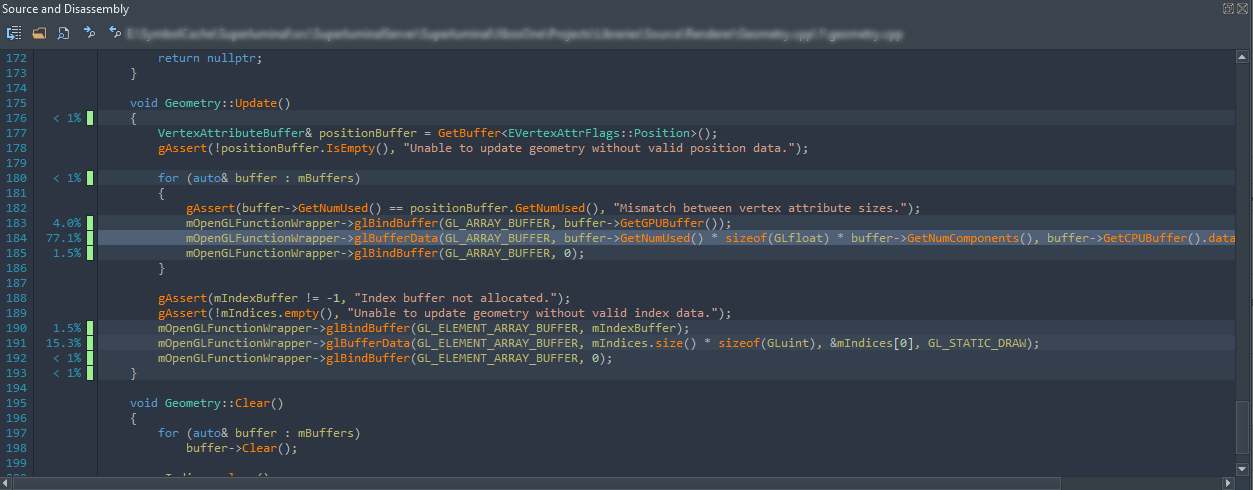
Source & Disassembly
The source window displays source code along with per line timing and thread state information. To drill down even deeper, a mixed-mode disassembly view lets you view per-instruction timing information. If no source code is available, the disassembly is displayed.
Filtering
Superluminal is capable of isolating a specific portion of a capture. Investigate unexpected frame spikes, or zoom in to the startup phase of your application.
And much more!
Take a look at our full list of features, or check out the cool stuff we have in store for you on the product roadmap
Client Selection


...and many more we can't show here because they're working on top secret projects...
What are you waiting for?
Download, Install, Optimize. Test all features for 14 days, no strings attached
We won’t ask you for any personal
information. Promise.