Features
Everything you could possibly dream of to optimize your game
Supported platforms & languages
Superluminal currently supports profiling applications on Windows, Xbox One, and PlayStation written in C++, Rust and .NET.
Built for Scale
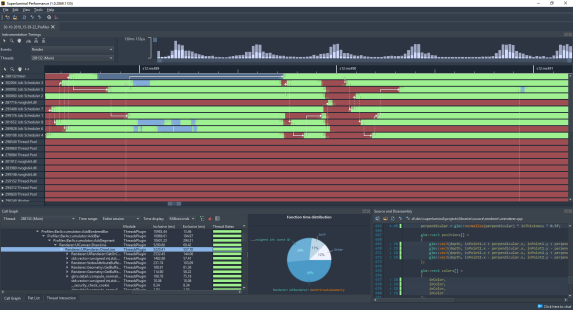
Superluminal has been built for scale from the ground up. You can record a few frames of data, or you can record a few hours of data – it’s all the same to us. Superluminal will remain stable, with low memory usage, while showing you your profiling data in a smooth and fast 60 FPS UI. Want to see CallGraph data for a specific bad performing piece in the timeline? Select a time range in the timeline view and all views will filter to that specific section in constant time – whether you’re selecting the entire range or a second somewhere in the middle of a huge capture.
Visual UI
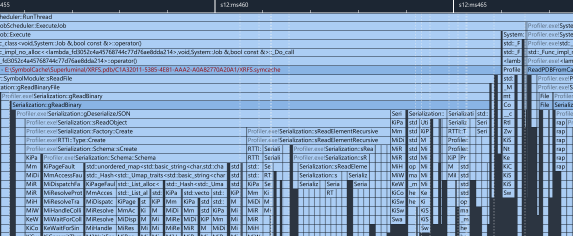
Traditionally reserved for instrumenting profilers, Superluminal is the only sampling profiler that displays the profiling data in a visual UI. Sampling data is displayed on a timeline, which allows you to see exactly, per thread, what function is being called when, what functions are being called around it and in what order. This gives you an unprecedented understanding of what’s happening in your program; understand not just what’s being called, but more importantly, why it’s being called. Of course, like everything else in Superluminal, our UI is built for scale — it will remain smooth at all times, no matter how much data you’ve captured.
Sampling
Superluminal is a sampling profiler. This allows you to hit the ground running without the need to make any code modifications. After install, you’ll be gathering performance data in no time. A powerful property of sampling is that it allows you to capture data from all code running your system, not just yours. System processes, third party code, it’s all included.
High-frequency
Most profilers sample at 1KHz, which is not very useful if you’re working on high-performance applications like games, which need to run at 30 or 60 FPS. In contrast, Superluminal has a high-frequency sampling engine that samples at 8 Khz (Windows) or 10 kHz (Xbox One). The high sampling frequency allows you to capture all the interesting work that’s happening in your application.
Kernel level stacks
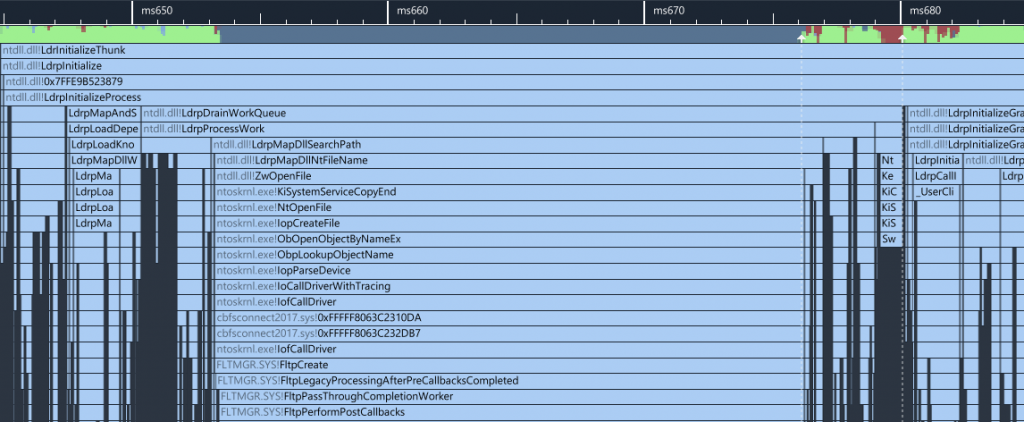
On Windows and Xbox One, Superluminal supports capturing kernel-level callstacks. This allows you to see exactly how the system calls you’re making traverse through the kernel. You’ll be amazed to see how a seemingly innocent system call will cause havoc, causing the kernel to page data in and out or locks system-wide mutexes. See exactly what happens at program startup and how DLLs are loaded and initialized.
Multithreading Analysis
Superluminal has first-class support for the analysis of modern, highly parallel applications. Understanding the complex interactions between threads in a program can be key in resolving performance issues. These complex interactions are visualized in an intuitive interactive interface that allows you to inspect blocking and unblocking call stacks and easily navigate between them.
Context Switches
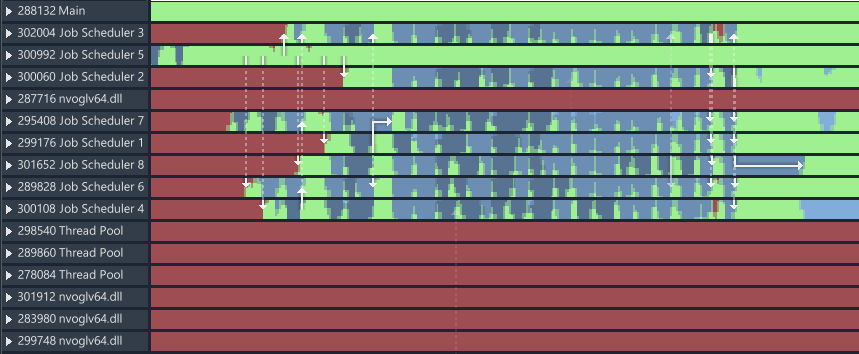
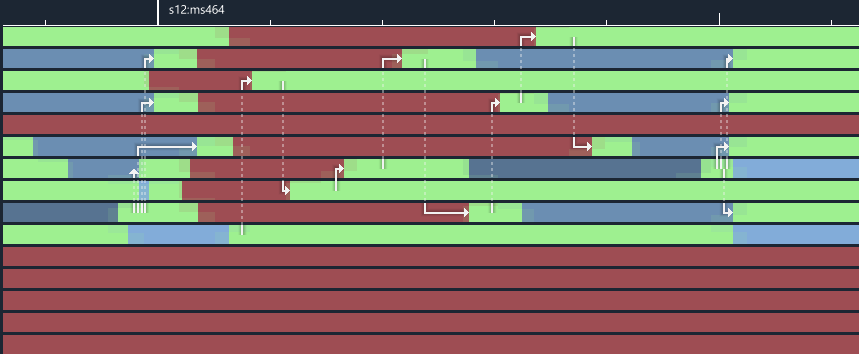
It’s easy to see, at a glance, what state a thread is in at any point in time — executing or waiting. The wait states are further colorized so you can visually distinguish between the different types of wait. This makes it easy to spot when your thread is waiting on a lock, when it has been preempted by the OS and many other different wait states.
Thread communication
While being able to see when a thread is in a wait state is very useful, what’s even more powerful is being able to investigate how that thread gets out of its wait state. The timeline view visually displays this relationship between threads through the use of arrows. Each arrow indicates a place where the source thread wakes the target thread. Each arrow can be selected to view further details about that event. This feature shines when you’re investigating issues where threads are fighting over a lock, or where you’re interested in understanding how threads interact with each other.
Thread interaction
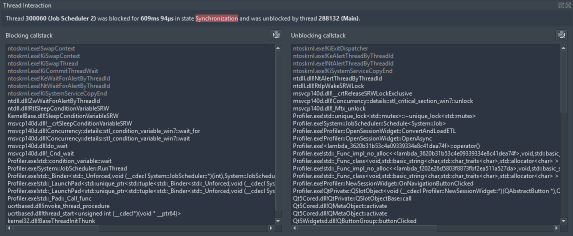
To allow you to dig even deeper in understanding the interaction between threads, the Thread Interaction window will show you the blocking and unblocking stack that belong to the arrow you selected. The blocking stack is the stack that caused the wait, while the unblocking stack is the stack that caused the wait to be unblocked. This allows you to go beyond which threads are fighting over a lock — now you can see the exact code that’s causing the wait, as well as the code that causes the waiting thread to continue executing.
Filtering
Superluminal is capable of isolating a specific portion of a capture. This is a powerful feature to investigate that one unexpected performance spike in your capture or to only view a certain section of the capture, like application startup code or that unexpected stall when a button was pressed. This filter is created by dragging a time selection in the timeline view. All views, like the callgraph, flat list, and source code view will use the filter. Like everything else in Superluminal, this has been built for scale – filtering happens in constant time.
Callgraph & Butterfly
When you need to view performance data in aggregate, we offer multiple views that can be used to look at your performance data from different angles. All of the views will respond to the active time filter.
Callgraph
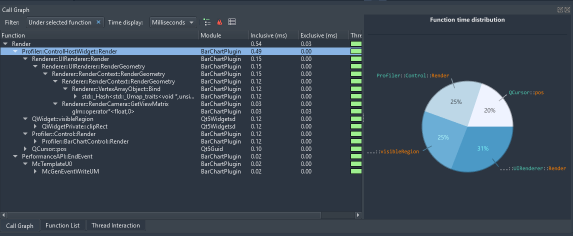
To quickly navigate the hot path in your code, the callgraph shows you the aggregate performance data in a hierarchical view. A pie chart clearly shows the time distribution of the selected node’s children at a glance.
Function list
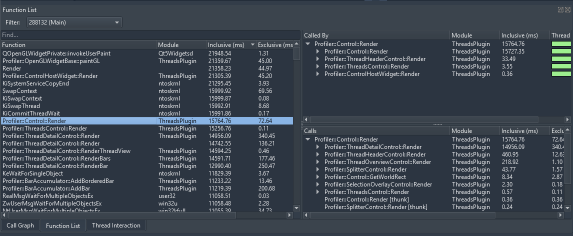
For bottom-up analysis, the function list can be used to quickly understand what functions are taking up all the time, regardless of where they were called from.
Butterfly
To figure out where your code is being called from and which code paths are the most expensive, the butterfly view can be used to navigate to callers of your functions.
Find
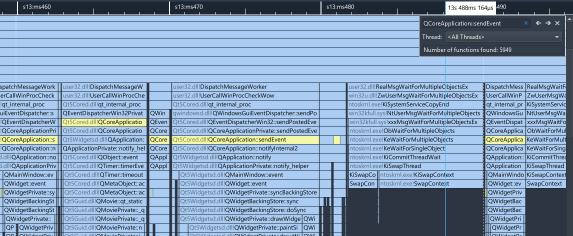
Superluminal supports capturing profiling data over an arbitrary length of time. To help you with navigating your way around your profiling data, Superluminal has a Find function, which can be used to find any function you want. When finding a function, the find results are visually highlighted in the timeline. This makes it easy to see at a glance where your function is being called. For cases where the function you’re interested in is called from multiple threads, it is possible to select only the threads you’re interested in.
Source & Disassembly
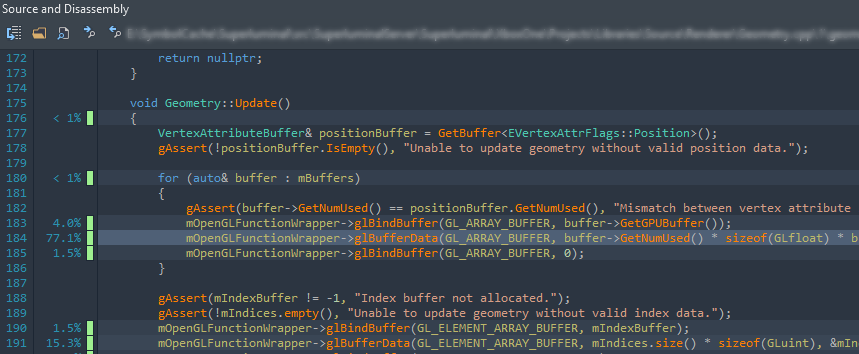
The source window displays source code along with per line timing and thread state information. To drill down even deeper, a mixed-mode disassembly view lets you view per-instruction timing information. If no source code is available, the disassembly is displayed.
Instrumentation
While our sampling engine offers unprecedented precision out of the box, sometimes you just need that little extra. Through the use of instrumentation, you can add more precision and context where needed. Instrumentation data is fully integrated into all views, including the timeline.
Instrumentation API
The API allows you to instrument relevant code in your application. This can be helpful to improve precision where needed, or to add contextual information like a filename, a size or an ID to an event.
Visual chart
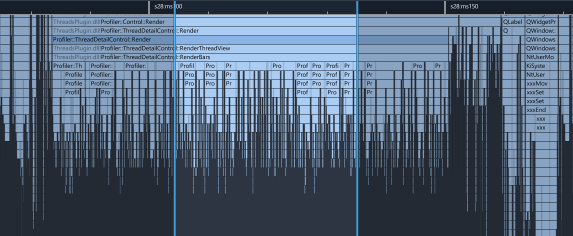
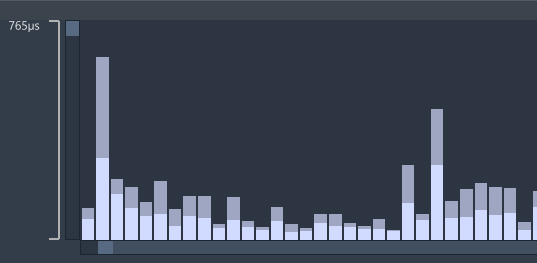
The instrumentation timings are a powerful way to quickly see average and peak performance behavior. A typical example for real-time rendering applications is that of a single rendering frame. When clicking on an event in the chart, all other views will navigate to the matching instrumentation event, allowing you to further investigate in detail.


