Superluminal for .NET
Push your performance optimisations to the next level with Superluminal’s support for .NET
Broad .NET version support
Superluminal supports all commonly used .NET versions: .NET Framework 4.0+, .NET Core 2.0+, and .NET 5+.

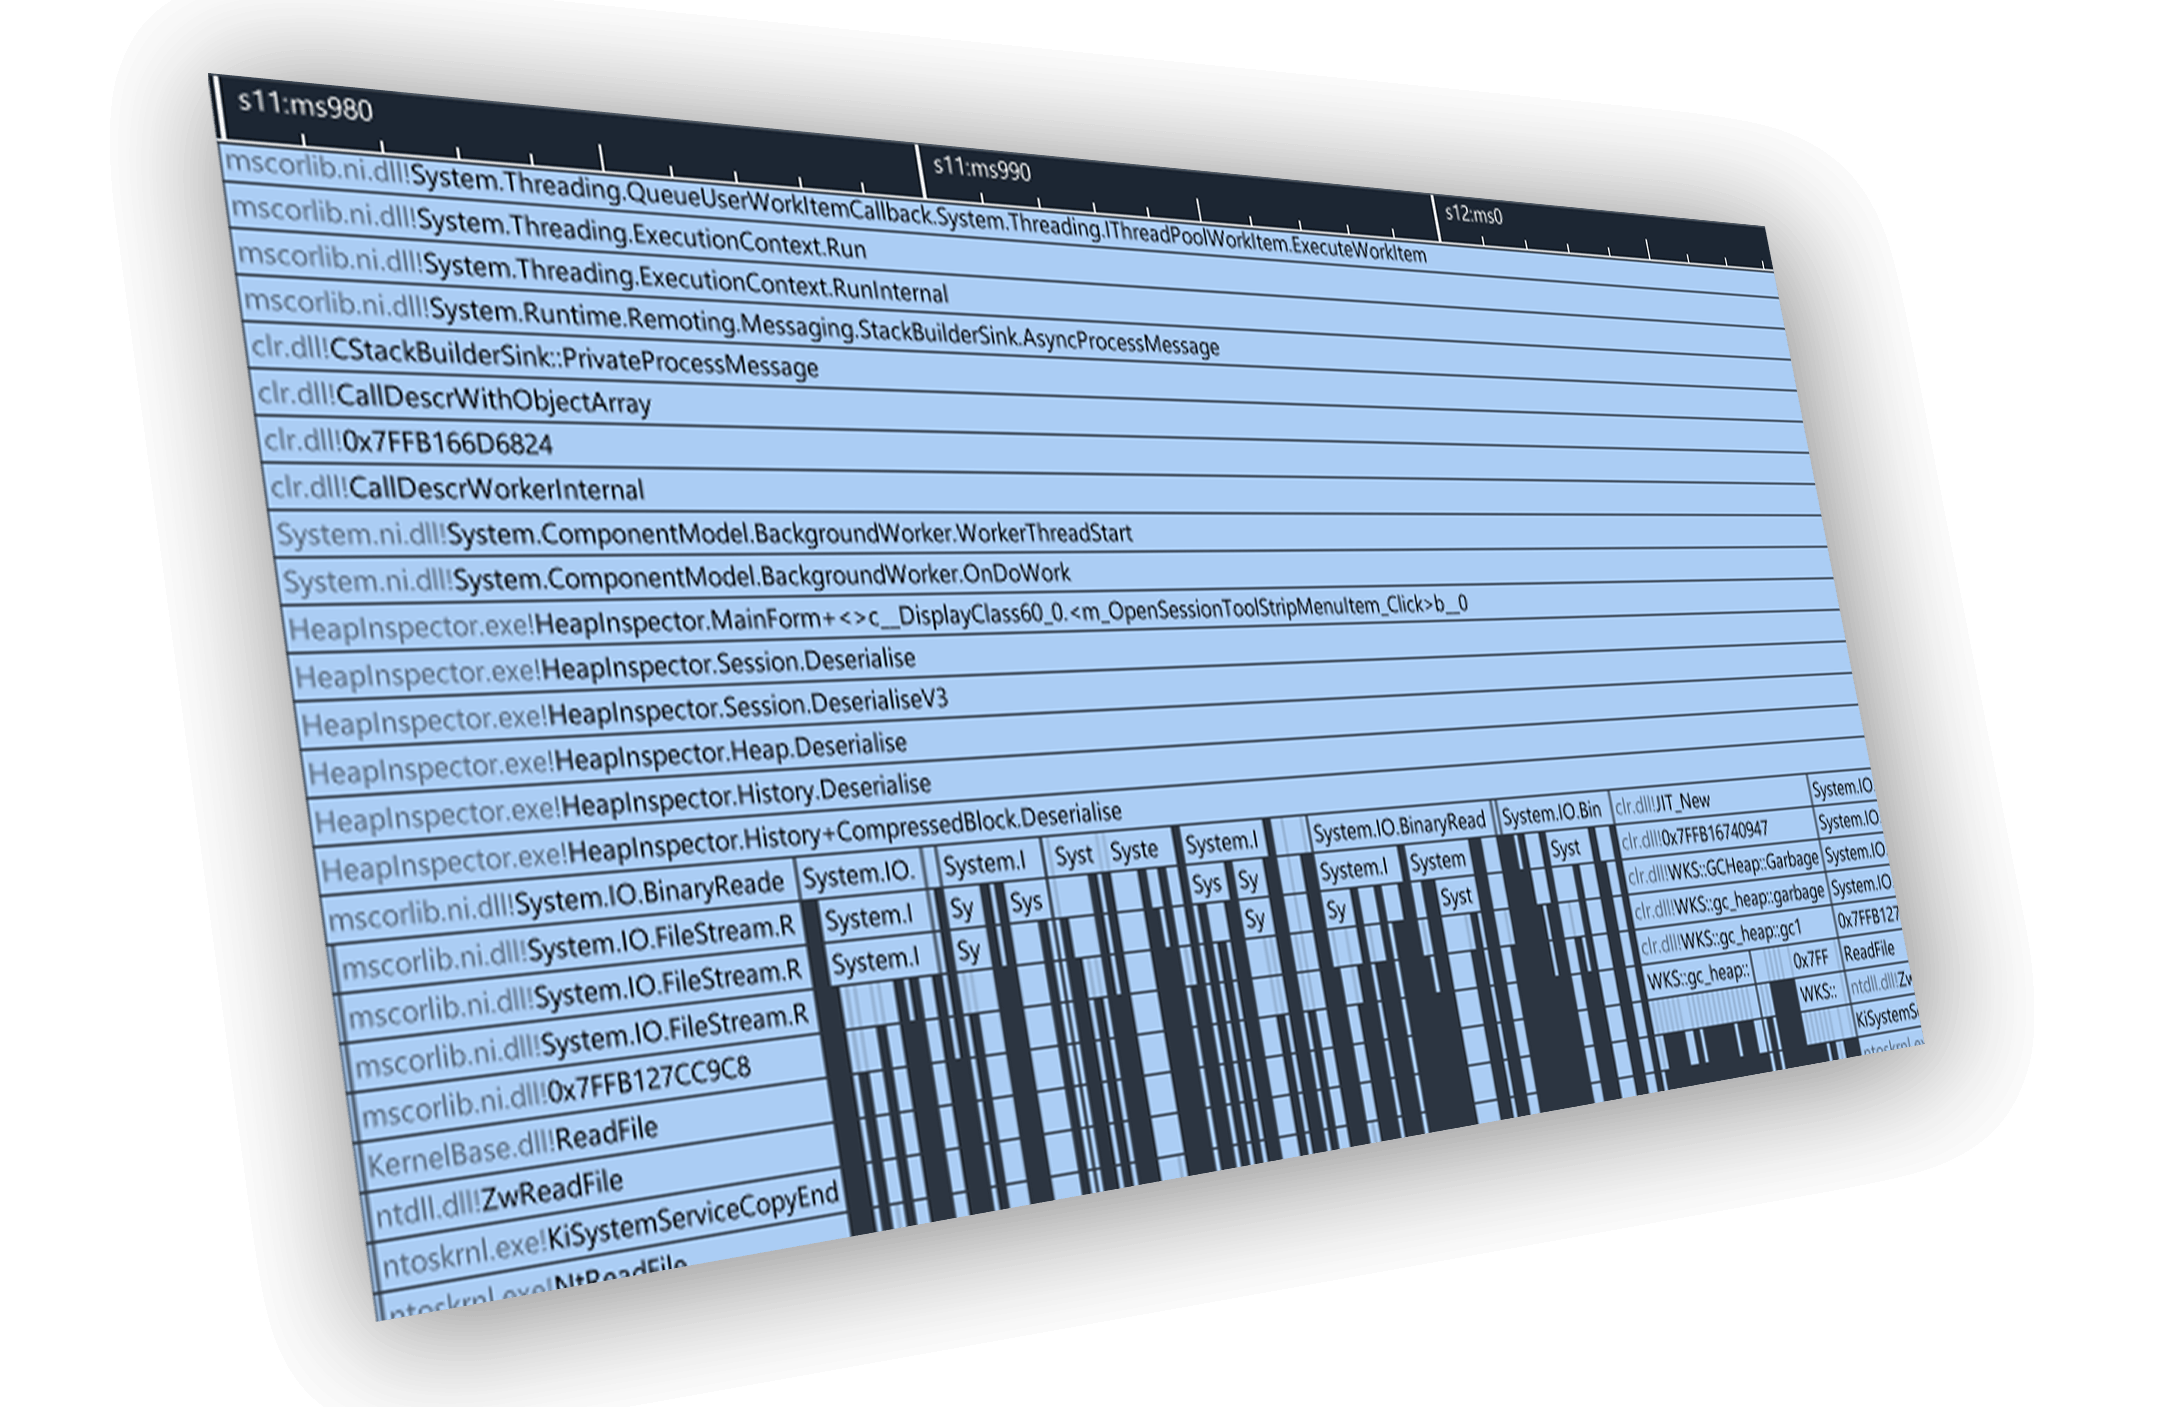
Mixed-mode stacks
With full support for both native and managed symbol resolving, you can inspect stacks down to the kernel level. See exactly what the runtime is doing: when your code gets JIT compiled and when garbage collection kicks in.

Seriously cannot recommend Superluminal profiler enough. It Just Works™ Case: VS locks up on project open for 2 minutes. Traced it, could instantly see where the problem was, and 5 min later, found the offending process. End to end, 7 min for what historically took ~2hrs
NuGet support
NuGet is an important part of the .NET ecosystem. If your project makes use of NuGet packages, Superluminal will automatically download symbols from NuGet’s servers when available. No manual configuration needed.


Source Link support
With full support for SourceLink, Superluminal will automatically fetch source files from SourceLink-supported source control systems such as GitHub, GitLab and Microsoft Azure Repos.
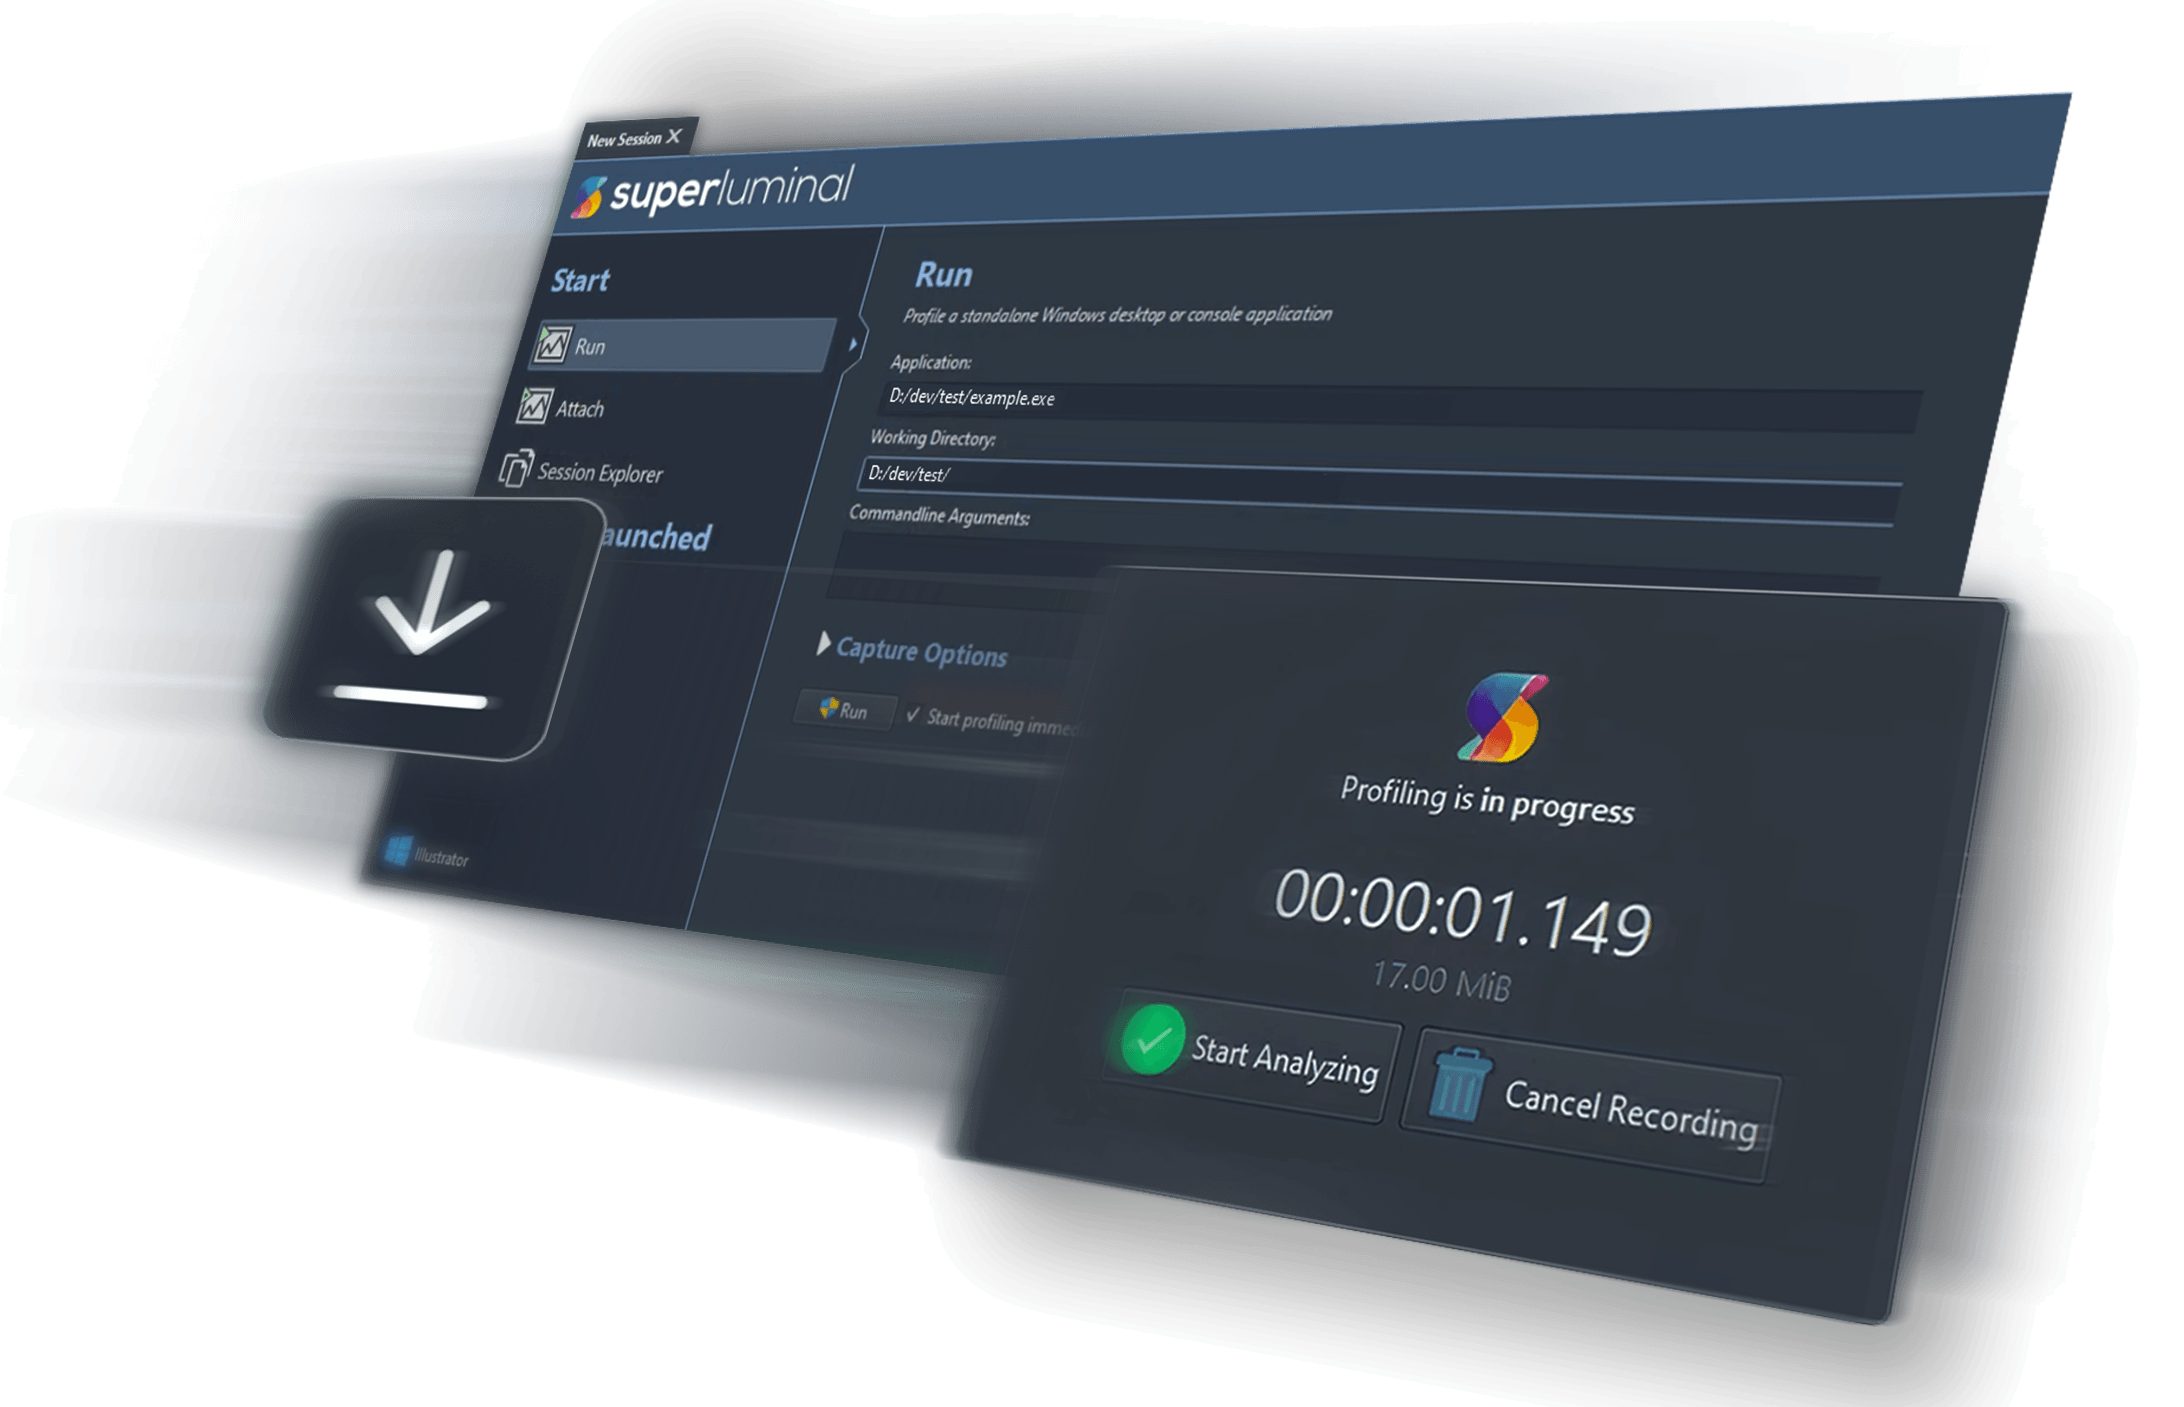
Ready, set, go!
Getting started is easy. Simply install Superluminal and run or attach to your .NET program directly from Superluminal. No code modifications needed.
If you need it, Alexandre Mutel (@xoofx) has generously built & published a NuGet package to make using our API super simple from .NET. See here for instructions.
And many more features
Visual UI
Superluminal is the only sampling profiler that displays the profiling data in a visual UI. Sampling data is displayed on a per-thread timeline, which allows you to see exactly what function is being called when, in what order, and what other functions are being called around it.
Multithreading Analysis
Understanding the complex interactions between threads in a program can be key in resolving performance issues. These complex interactions are visualized in an intuitive interactive interface that allows you to inspect blocking and unblocking callstacks and easily navigate between them.
High Frequency Sampling
High frequency sampling (8 – 40 kHz, depending on platform) allows you to hit the ground running without the need to make any code modifications. Sampling can start right from the start of the application, allowing you to inspect application startup, including DLL loading, the static initialization phase and more.
Source & Disassembly
The source window displays source code along with per line timing and thread state information. To drill down even deeper, a mixed-mode disassembly view lets you view per-instruction timing information. If no source code is available, the disassembly is displayed.
Filtering
Superluminal is capable of isolating a specific portion of a capture. Investigate unexpected frame spikes, or zoom in to the startup phase of your application.
Trusted by thousands of users
Including hundreds of studios and over 50 AAA studios
Superluminal is great.
Its UI is really simple & quickly allows you to go from overview, thread interactions, PC samples, to source and disassembly. We fixed many performance issues, including ones we didn’t even know we had.
An utter joy to use.
I went from download to profiling in five minutes. An hour later, several embarrassing performance issues were made painfully obvious. After just four days, I got our frame-time down from 50 to 20 milliseconds.
It just works.
Seriously cannot recommend Superluminal profiler enough. It Just Works™ Case: VS locks up on project open for 2 minutes. Traced it, could instantly see where the problem was, and 5 min later, found the offending process. End to end, 7 min for what historically took ~2hrs.


14 day free trial
All features included, no strings attached.
Find out for yourself what it's like to use a CPU profiler built by developers, for developers, who really care about performance.