Superluminal for Windows
Gather high-frequency sampling data from any running process in Windows.
Download. Install. Run.
No pages of installation guides. No Gigabytes to download and install. Just unzip, run and focus on performance issues. It Just Works™.
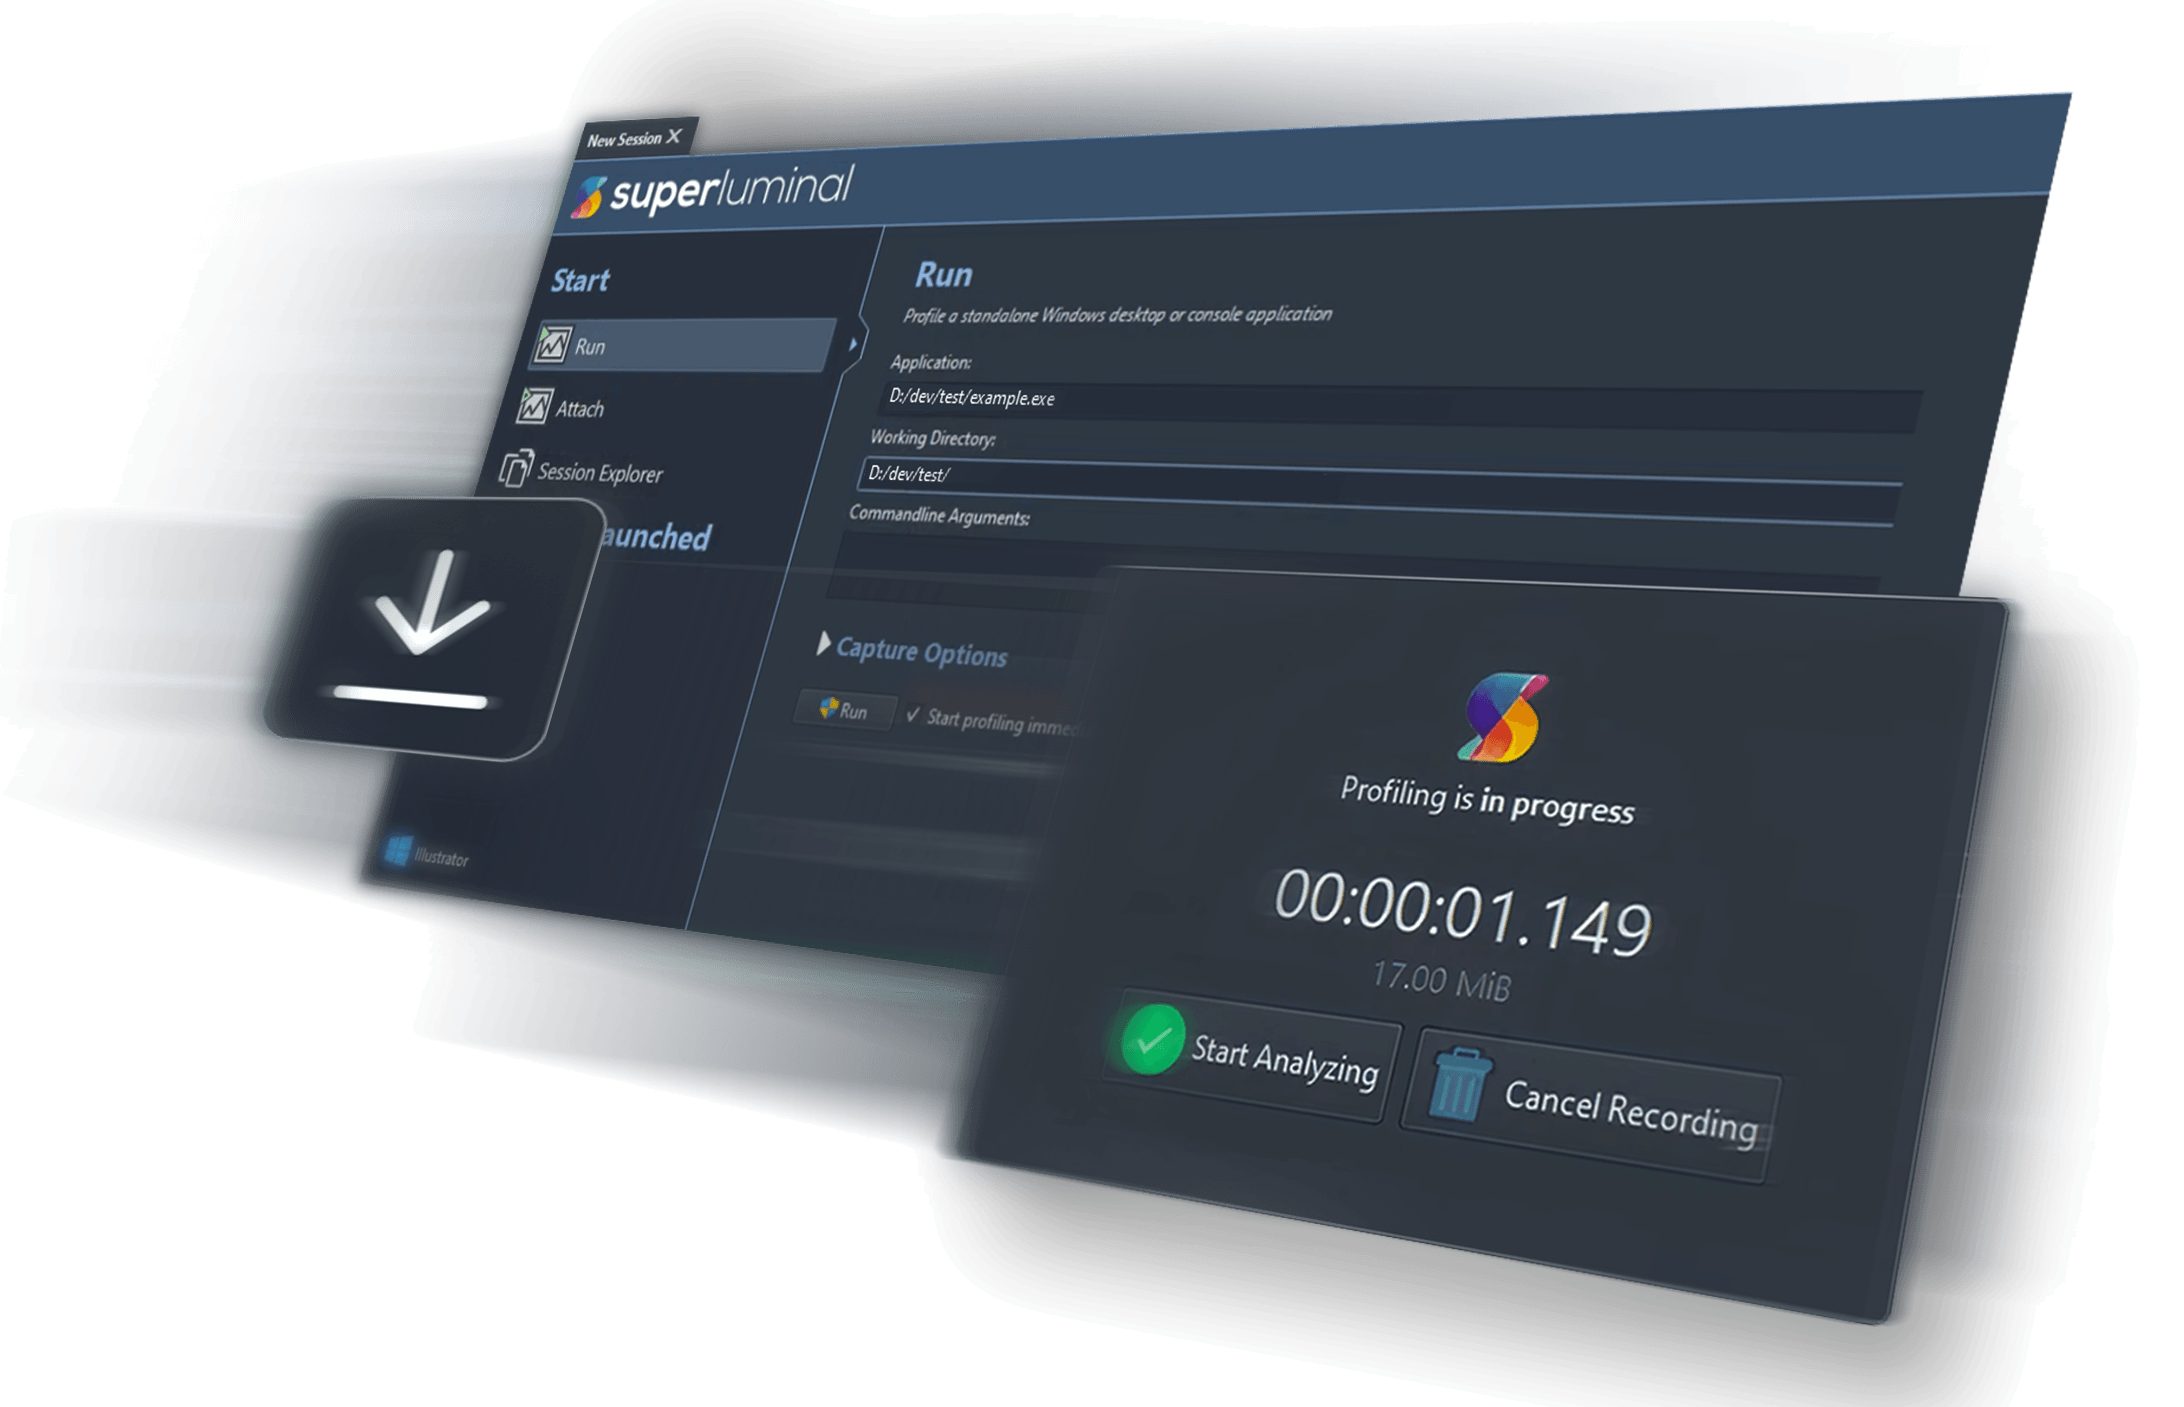

Superluminal is the first PC profiling product that I can remember that worked smoothly out of the box and provided useful data. On top of that it has a really nice UI and is intuitive from the start. Really nice product in a space that has been full of really poor ones.
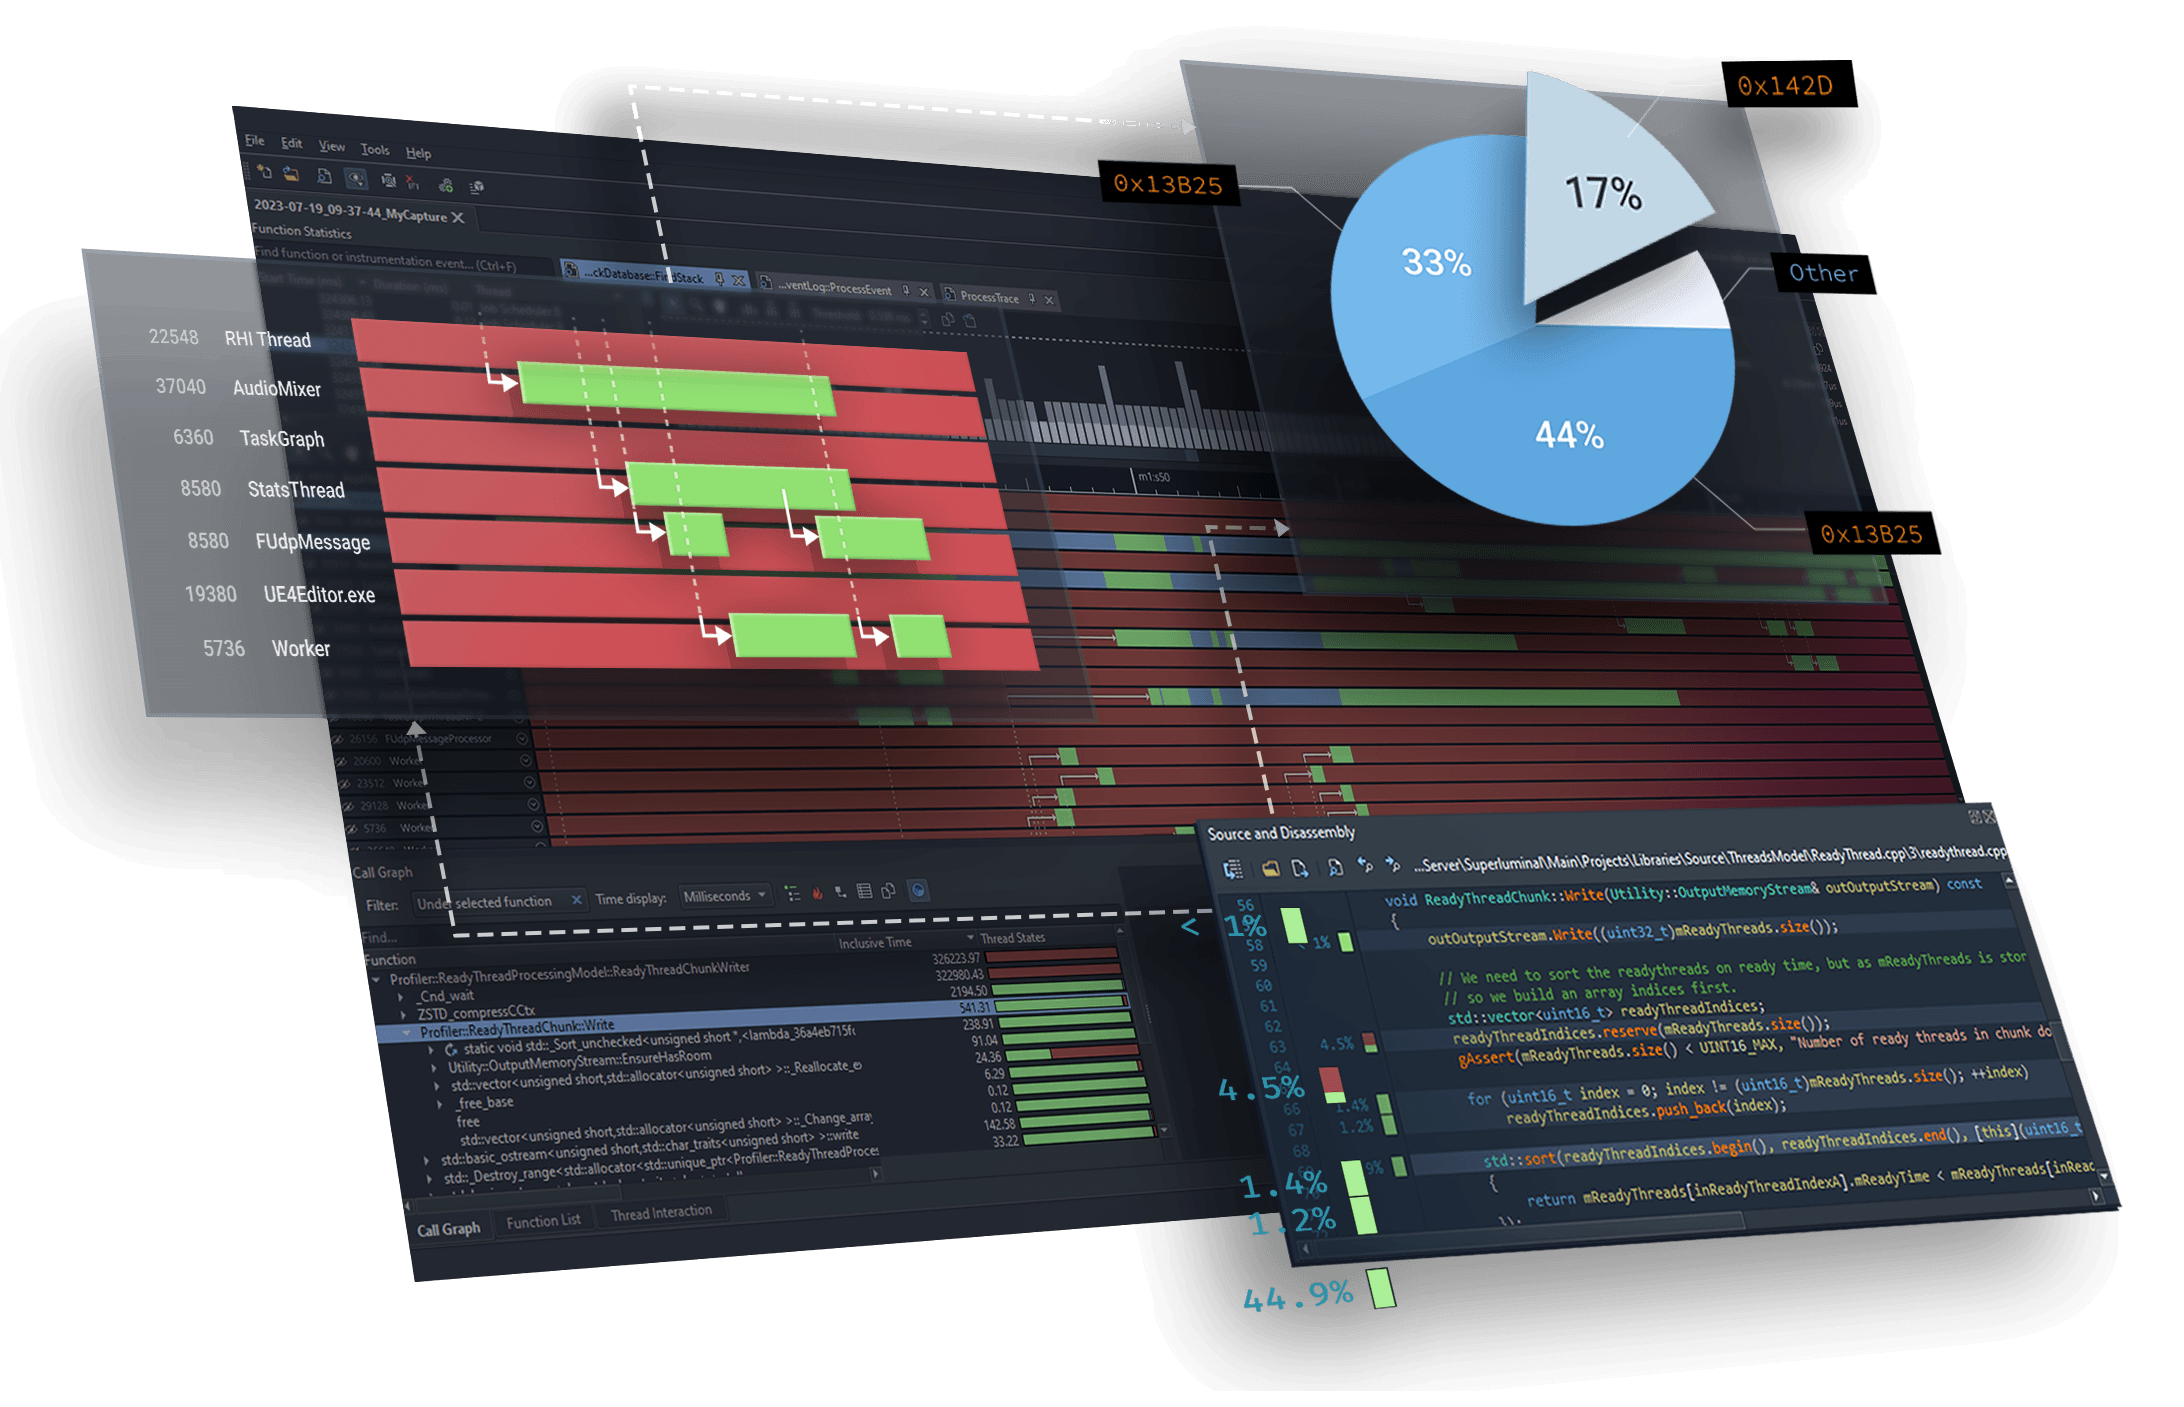
A simple but powerful UI
Does your profiler look like a spreadsheet right now? Instead of dumping raw data on you, Superluminal’s UI is tailored to real-life profiling workflows. You don’t need a master’s degree in profiling anymore.

Fast, responsive, stable
Whether you’re capturing a few frames or a multi-hour session on a massive complex codebase, Superluminal can handle it without lagging or crashing.
Its core is architected so that capture size doesn’t punish you: frame-rate, memory usage, and lookup times stay snappy, delivering a smooth, responsive 60 FPS UI even when you’re digging through hundreds of gigabytes of profiling data.
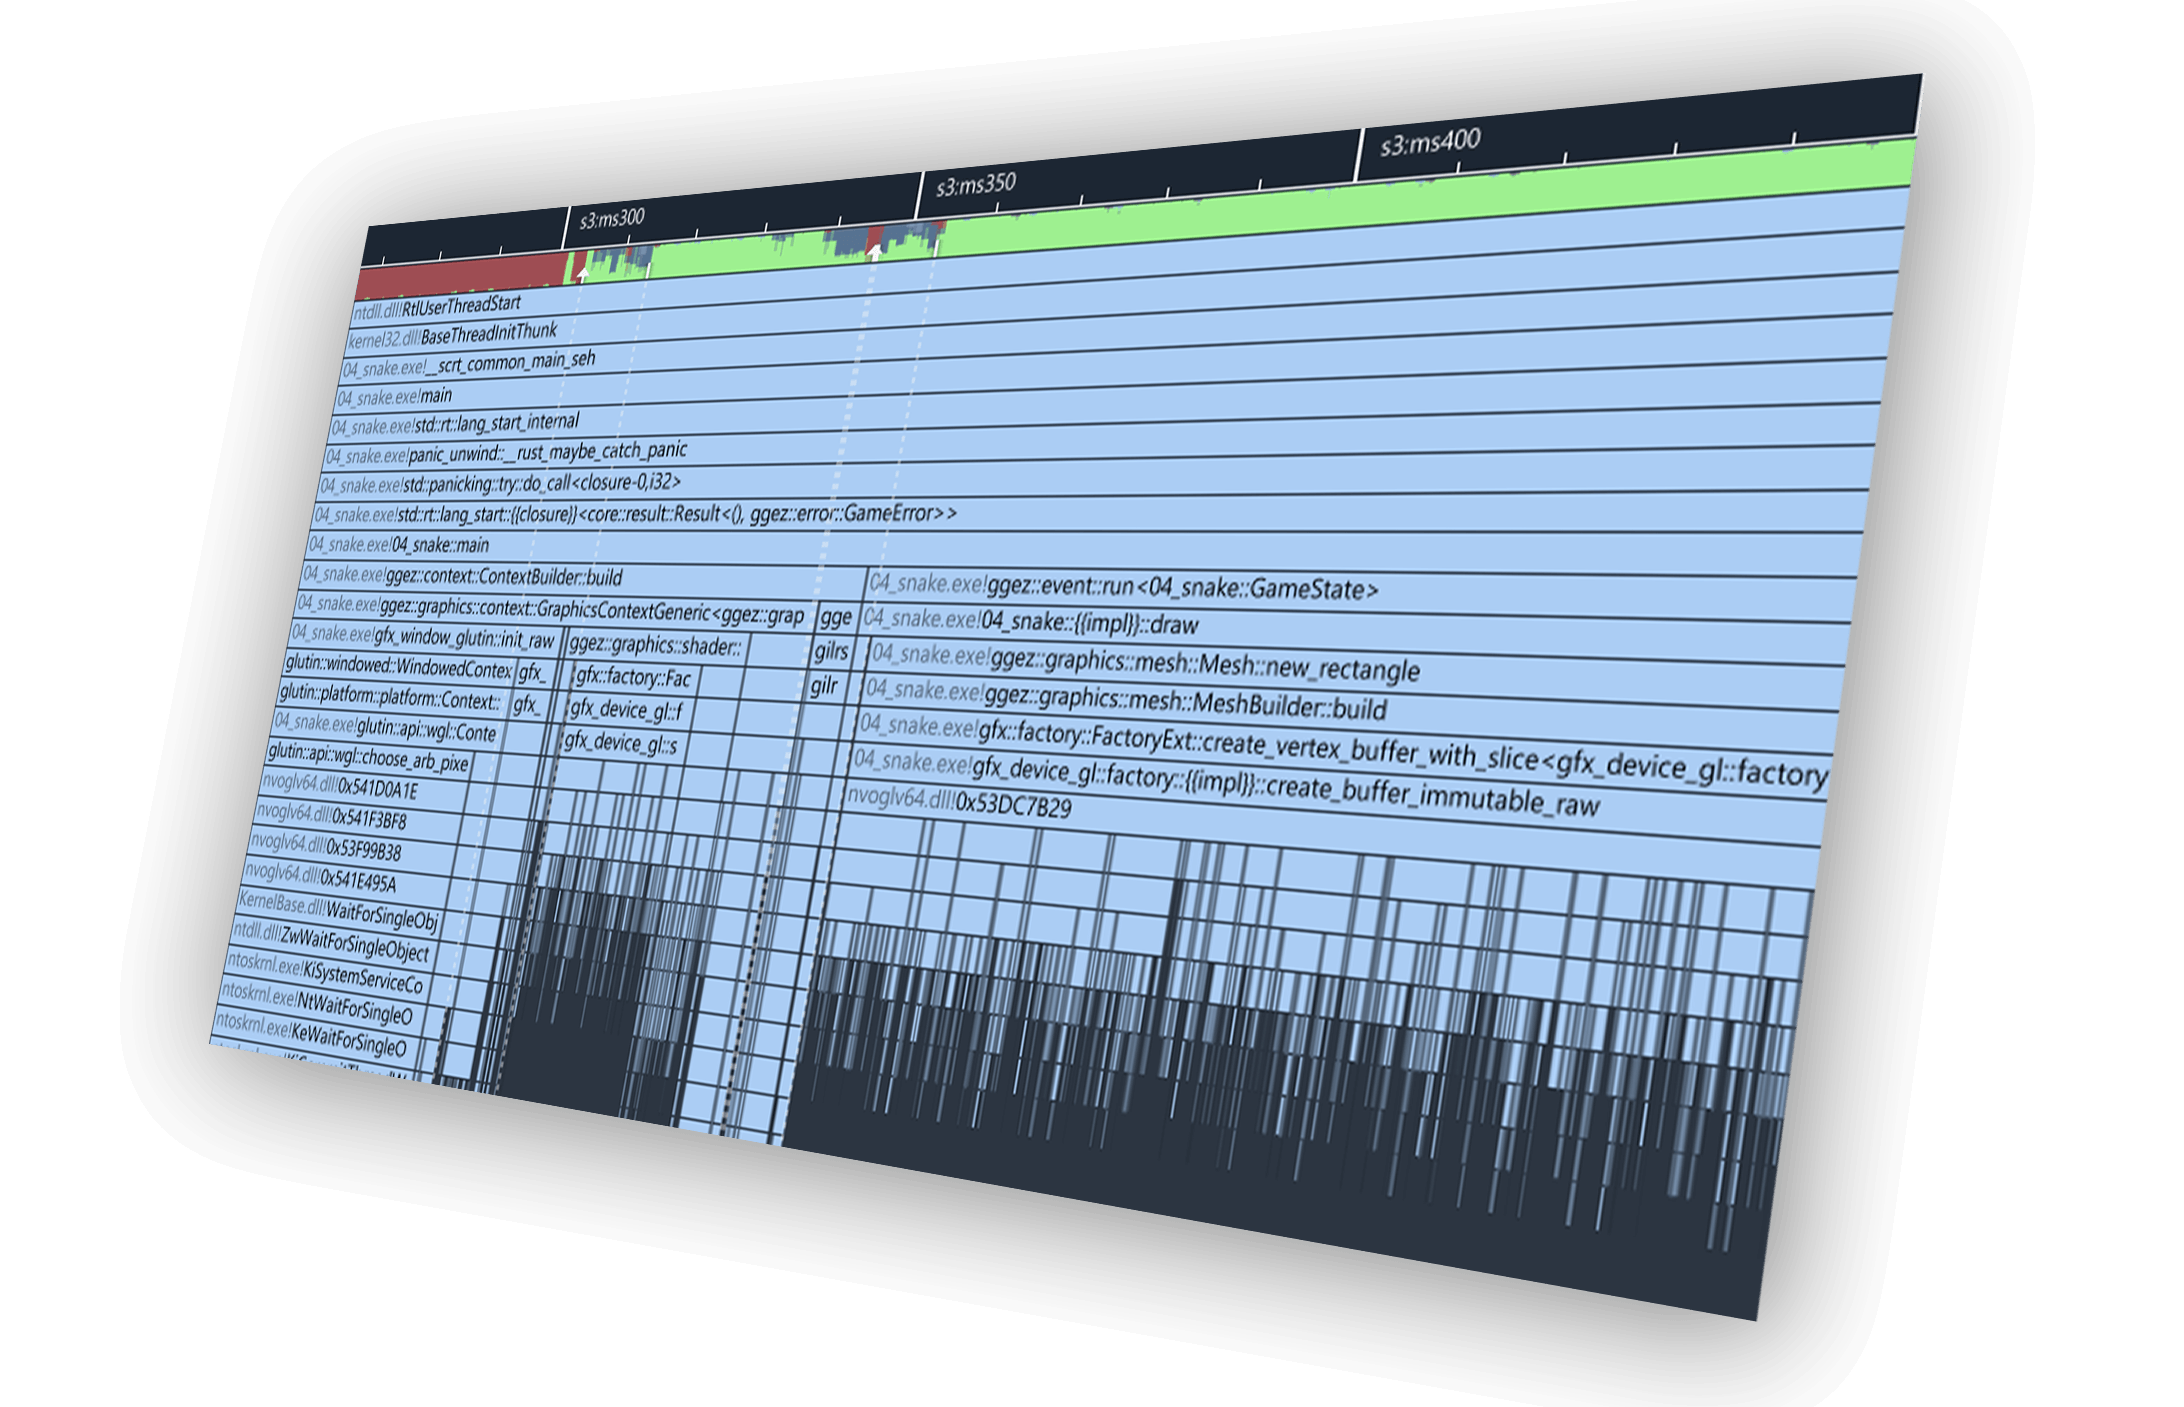
High frequency sampling
Sampling allows Superluminal to show you what is really happening in your code by capturing performance data from everything running on your system – your code, third party libraries, system processes, even kernel level stacks – nothing can hide.
With a sampling rates of 8 kHz, it delivers rich callstacks and deep insights that traditional 1 kHz profilers just can’t match.
Kernel-level profiling
Superluminal captures callstacks right down to the kernel level, allowing you to see exactly how the system calls you’re making traverse through the kernel.
You’ll be amazed to see how a seemingly innocent system call will cause havoc, causing the kernel to page data in and out or locks system-wide mutexes.
And many more features
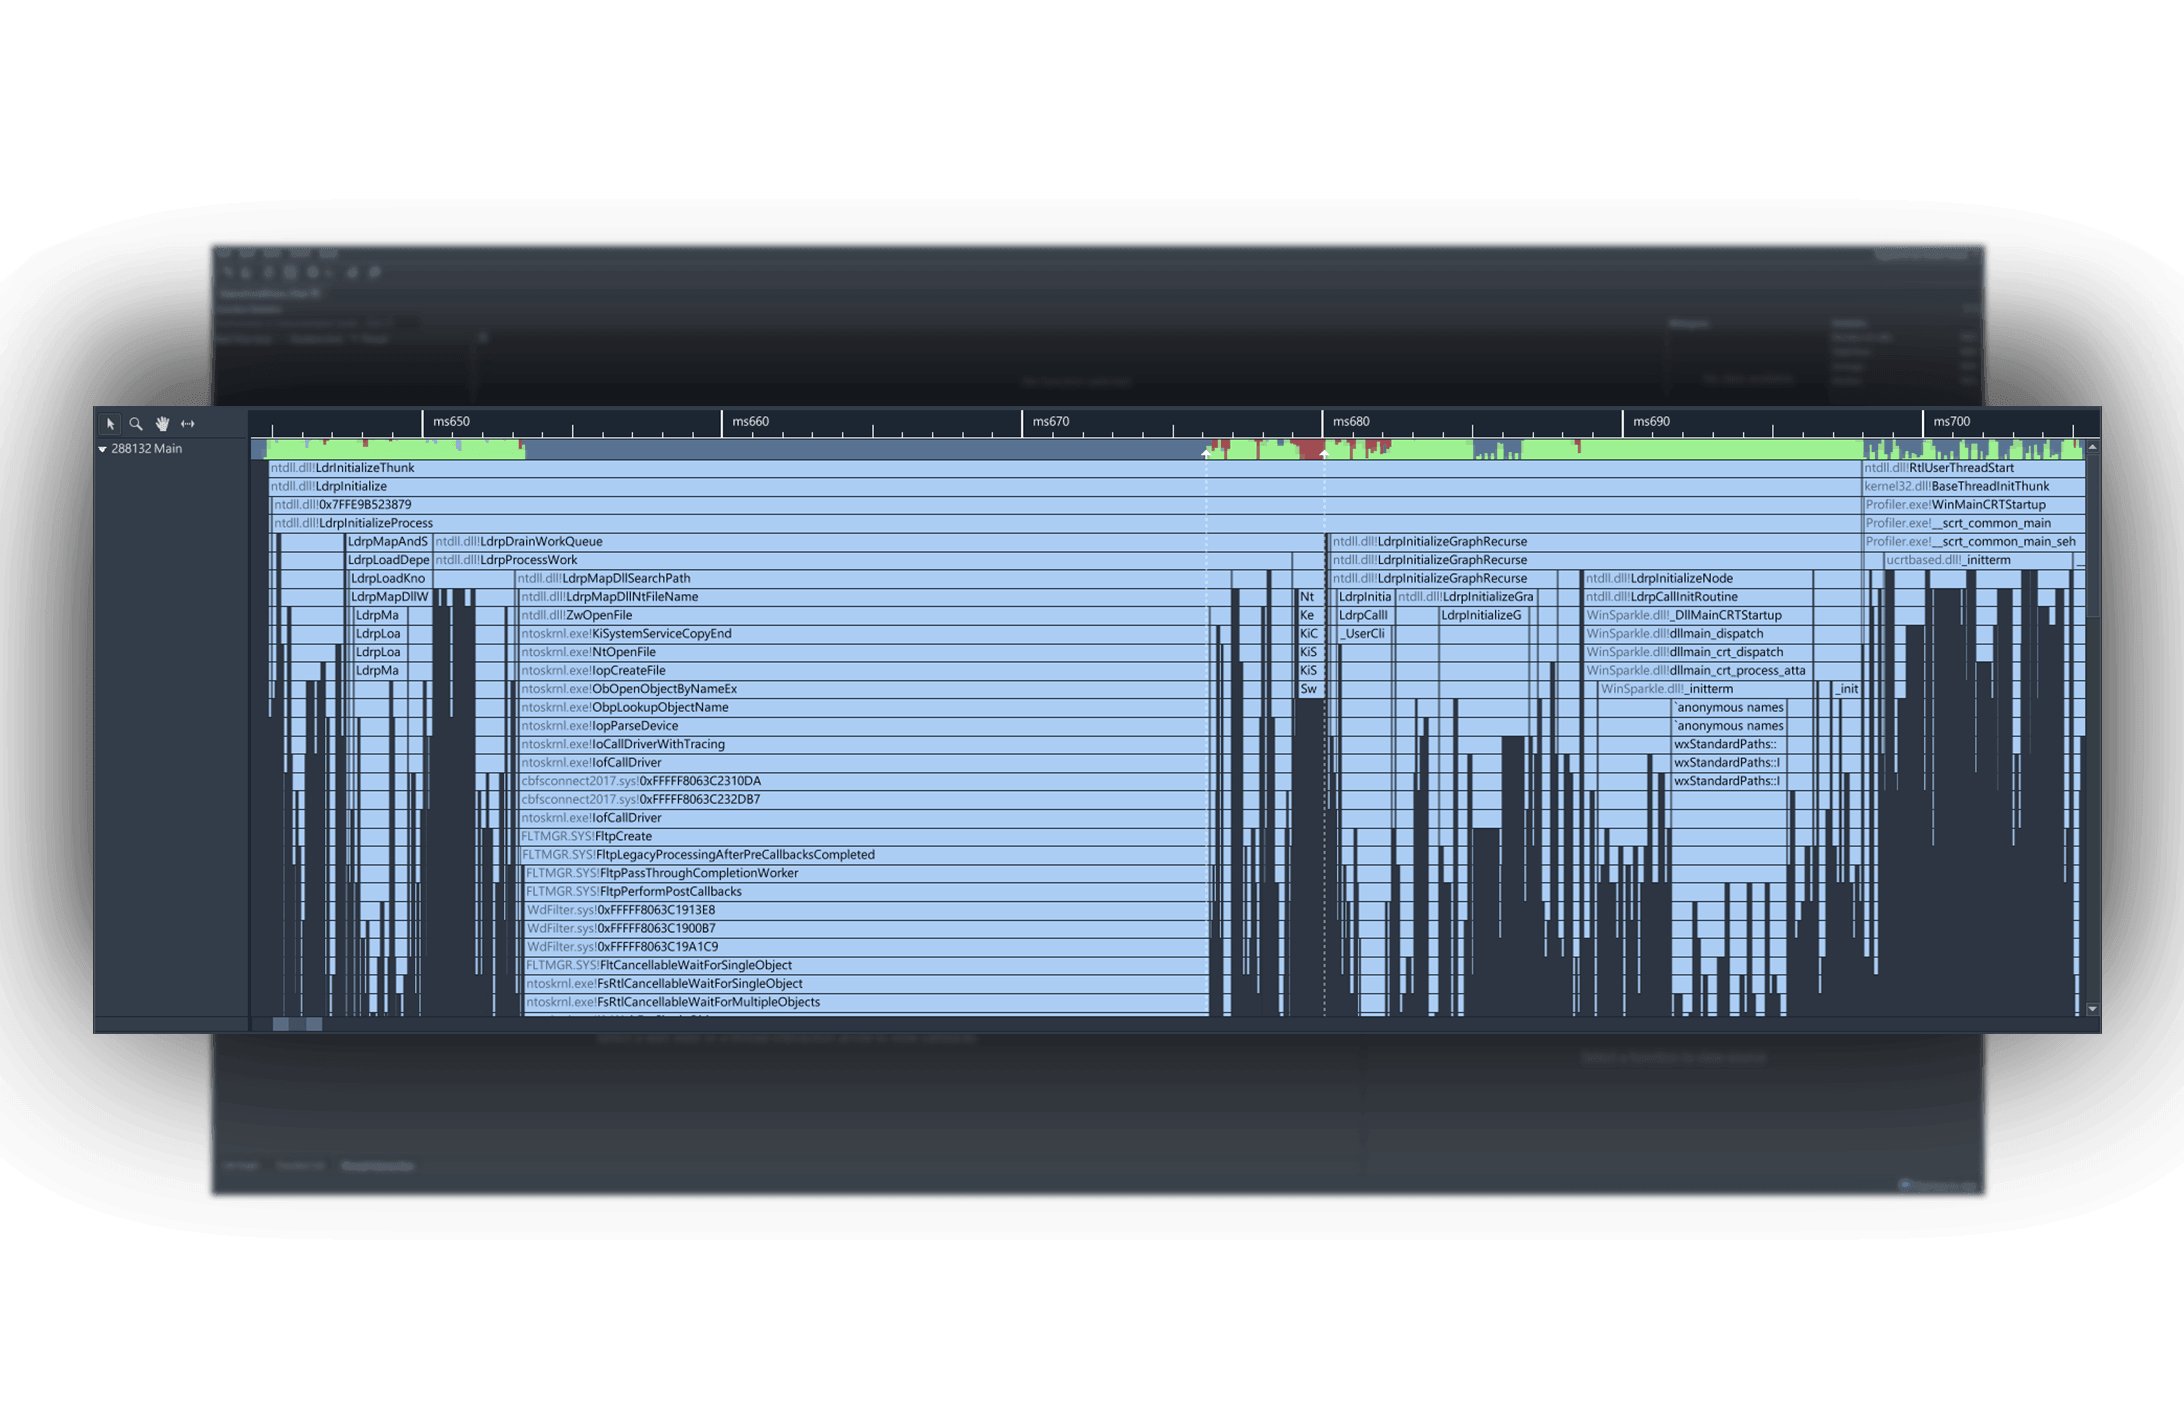
Visual UI
Sampling data is displayed on a per-thread timeline, allowing you to see what function is being called when, in what order, & what other functions are being called around it.
Multithreading analysis
These complex interactions are visualized in an intuitive interactive interface, allowing you to inspect blocking and unblocking callstacks.
High frequency sampling
High frequency sampling (8 – 40 kHz, depending on platform) allows you to hit the ground running without the need to make any code modifications.
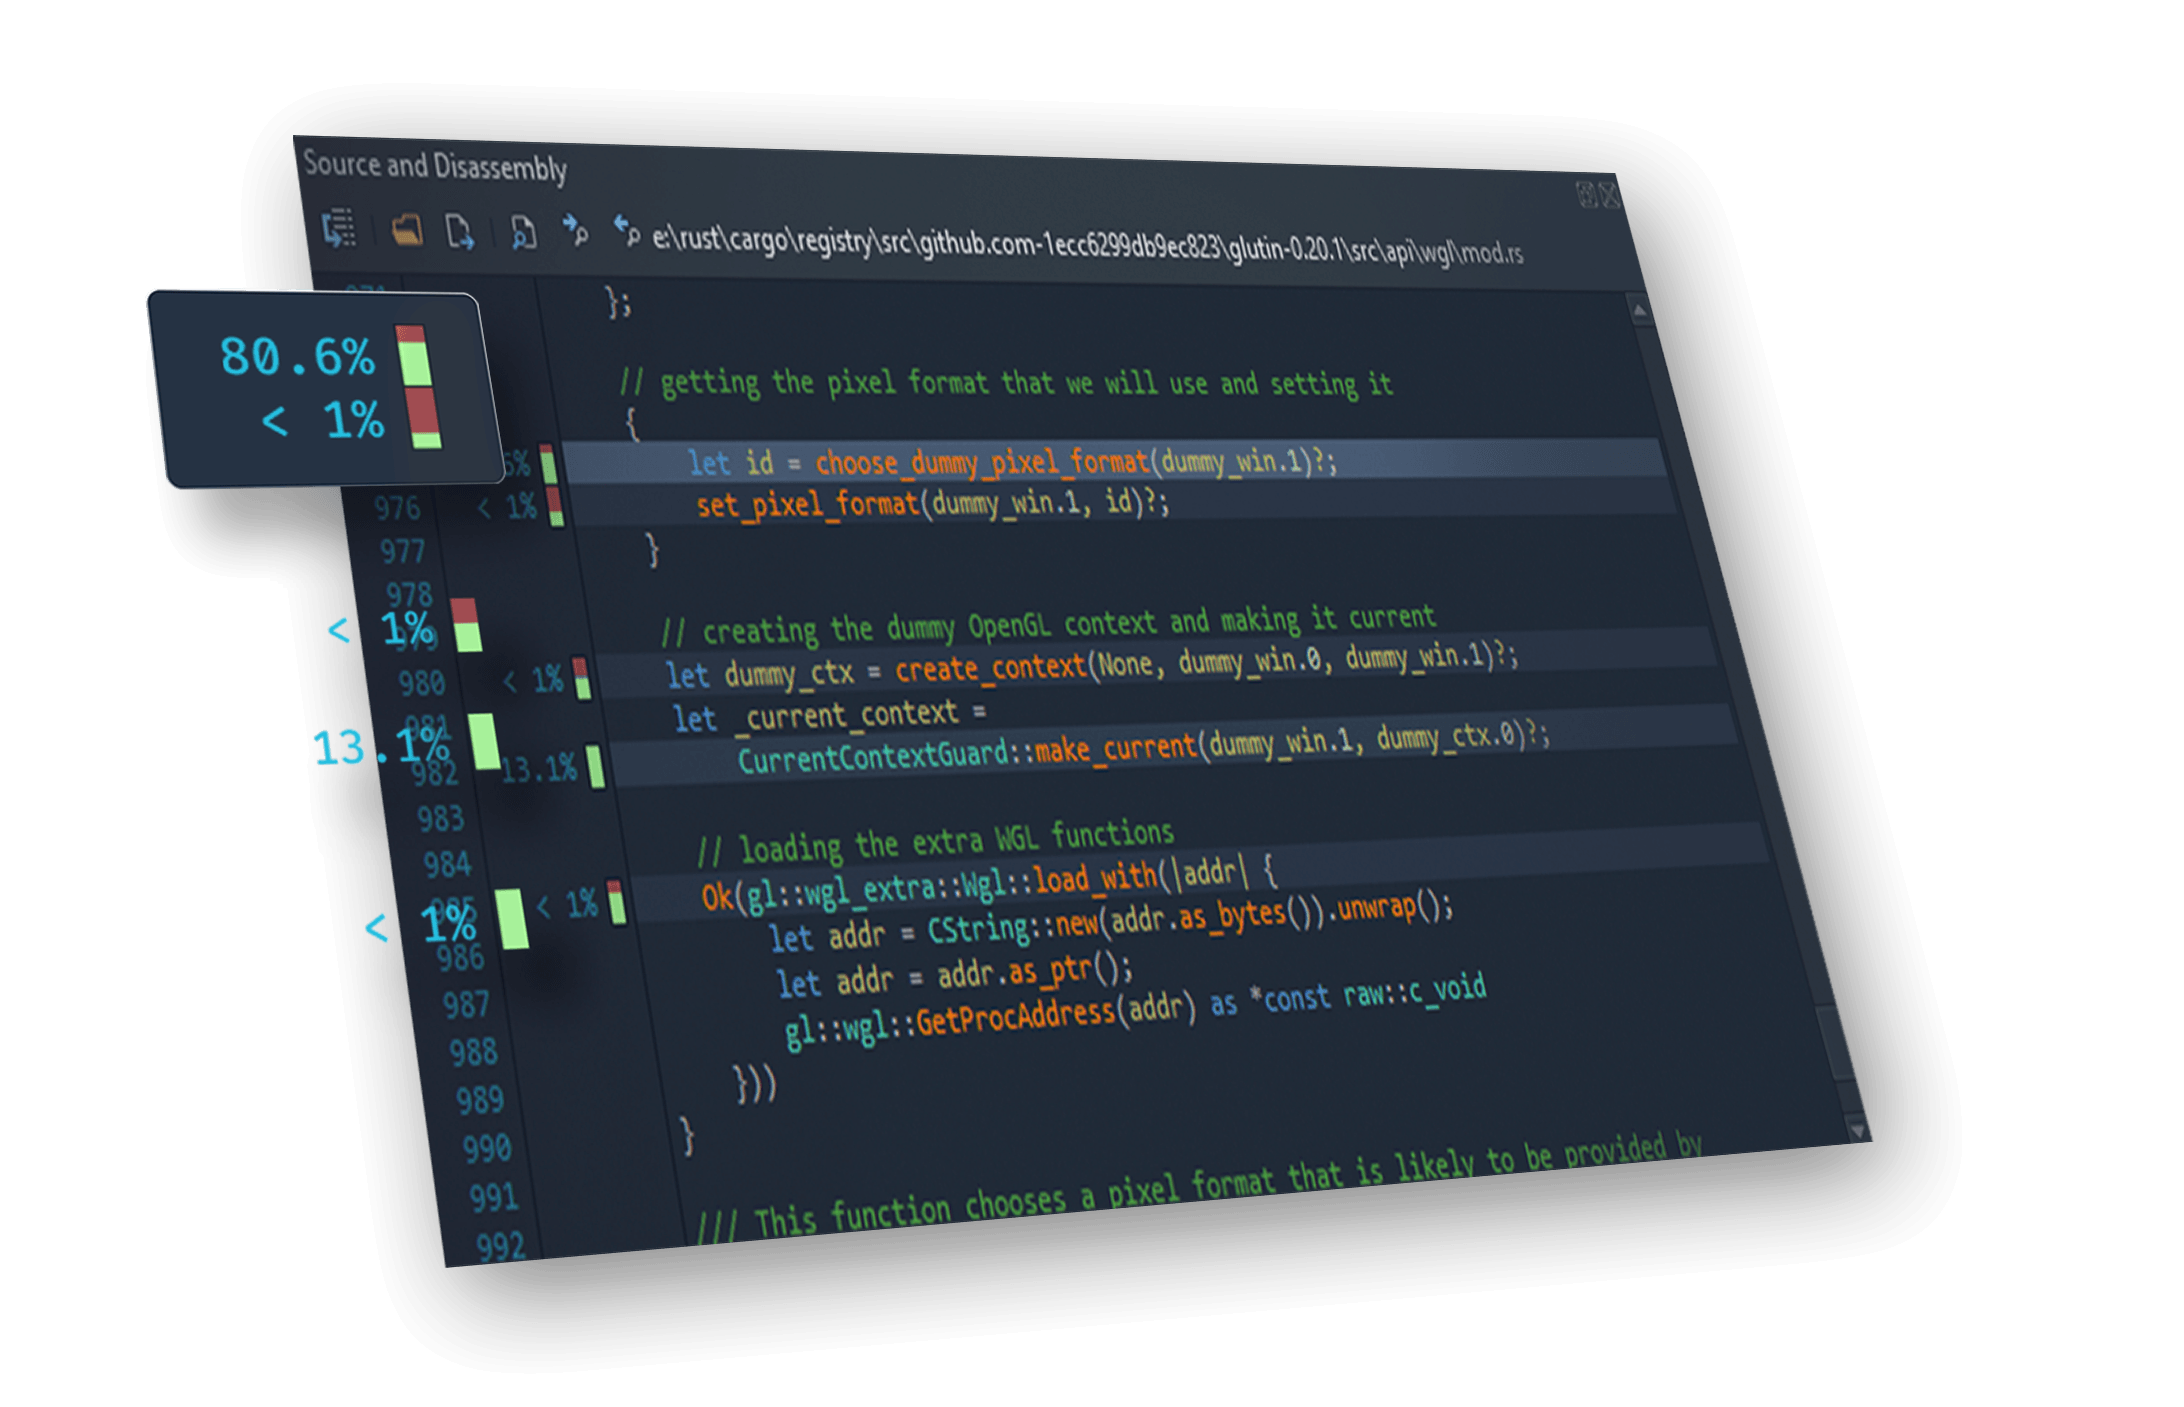
Source & Disassembly
A mixed-mode disassembly view lets you view per-instruction timing information. If no source code is available, the disassembly is displayed.
Filtering
Superluminal is capable of isolating a specific portion of a capture. Investigate unexpected frame spikes, or zoom in to the startup phase of your application.

Trusted by thousands of users
Including hundreds of studios and over 50 AAA studios
Superluminal is great.
Its UI is really simple & quickly allows you to go from overview, thread interactions, PC samples, to source and disassembly. We fixed many performance issues, including ones we didn’t even know we had.
An utter joy to use.
I went from download to profiling in five minutes. An hour later, several embarrassing performance issues were made painfully obvious. After just four days, I got our frame-time down from 50 to 20 milliseconds.
It just works.
Seriously cannot recommend Superluminal profiler enough. It Just Works™ Case: VS locks up on project open for 2 minutes. Traced it, could instantly see where the problem was, and 5 min later, found the offending process. End to end, 7 min for what historically took ~2hrs.
Multi-platform
Explore our other applications

Support for PlayStation® 4 and PlayStation® 5, including high frequency capturing up to 40 kHz.
Superluminal for PlayStation

Optimized from the ground up to offer high performance sampling natively on Linux.
Superluminal for Linux
14 day free trial
All features included, no strings attached.
Stop fighting with your CPU profiler and start fixing performance.