What makes Superluminal different
Your performance workflow, supercharged.
Battletested against the world’s largest projects.
Superluminal has been engineered from the ground up for performance and stability, at scale. When other profilers choke and crash under pressure, Superluminal keeps going.
Thousands of thread? No problem. Hundreds of gigs of data? We’ve got you. Superluminal is proven to deliver even hours long captures and the most complex codebases.


Built by devs, for devs, with real world workflows in mind.
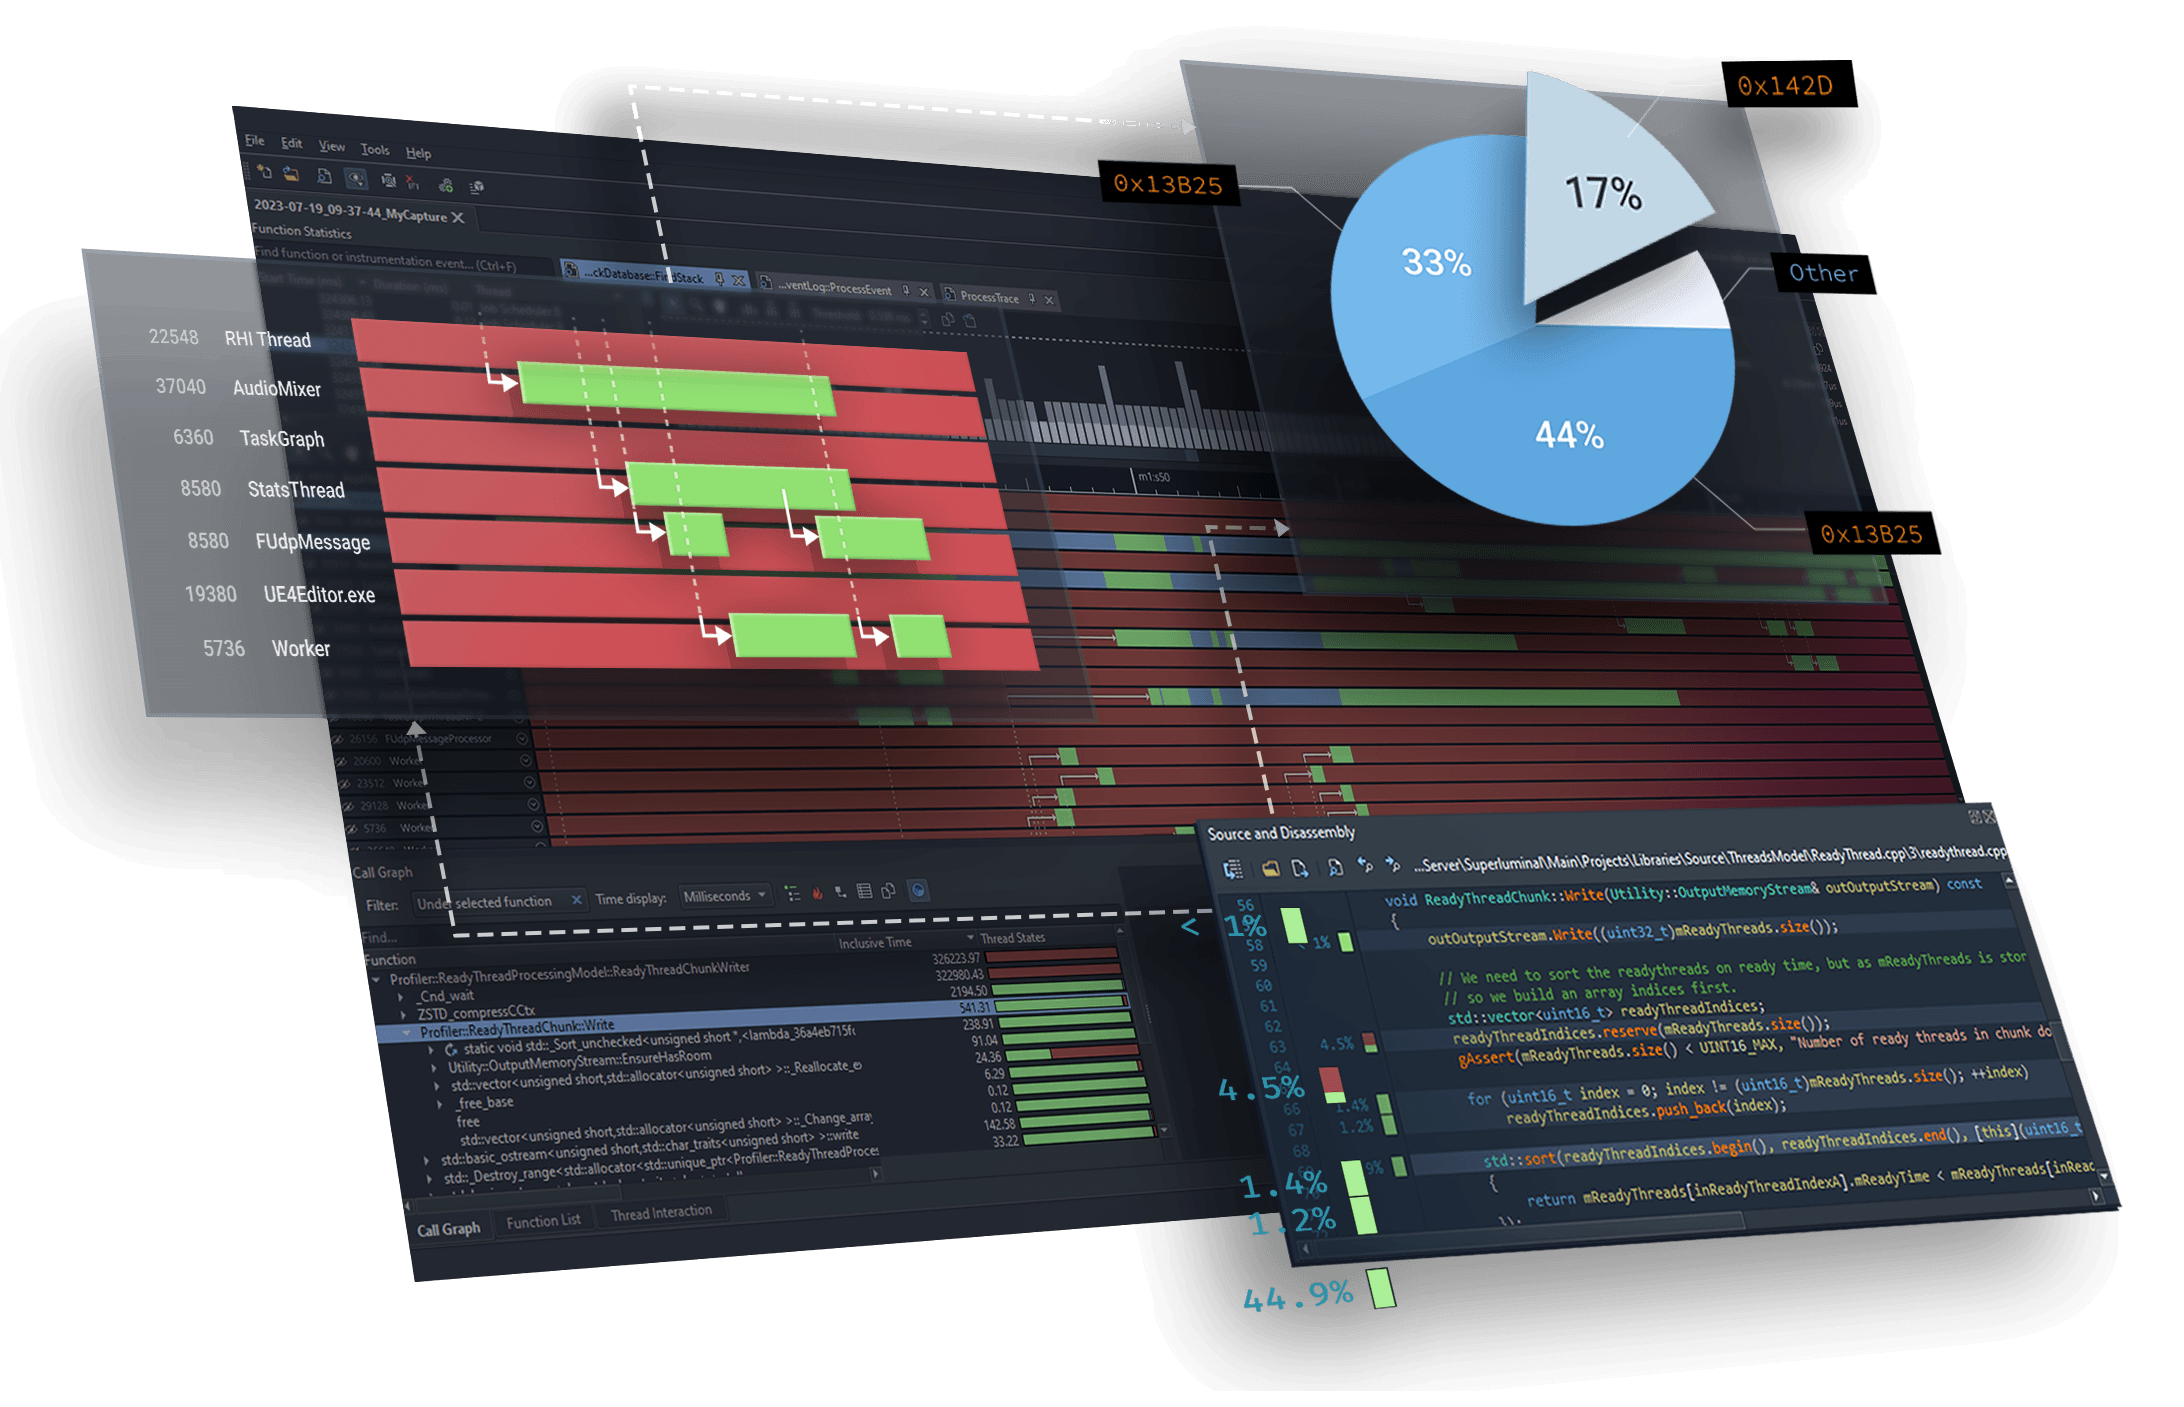
Get a visual breakdown of exactly what’s happening in your application. Easily identify bottlenecks across multiple threads, see the interactions and drill down all the way to the instruction level in real time, using one seamless UI.
Unlike other profilers that dump raw data tables, our interface is designed to show you the information you need, when you need it, in a way that actually makes sense.
Installs in minutes. Saves you hours of headaches.
Here’s how most profilers work: download the tool, modify your source code, configure a million settings just right, cross your fingers, and hope it doesn’t break your build.
Here’s how Superluminal works: download, run, profile. That’s it. No code modification. No integration hell. Just frictionless performance analysis, from download to your first optimization in minutes.
Multi-platform
One profiler to rule them all
Superluminal works across all major platforms. That means one UI to learn and one workflow for your entire team. No more switching between platform-specific tools. No more relearning interfaces. Just consistent, powerful performance analysis wherever your code runs.