The fastest way to visually analyse your performance captures
Built by developers, for developers.
Easily identify bottlenecks with full context.
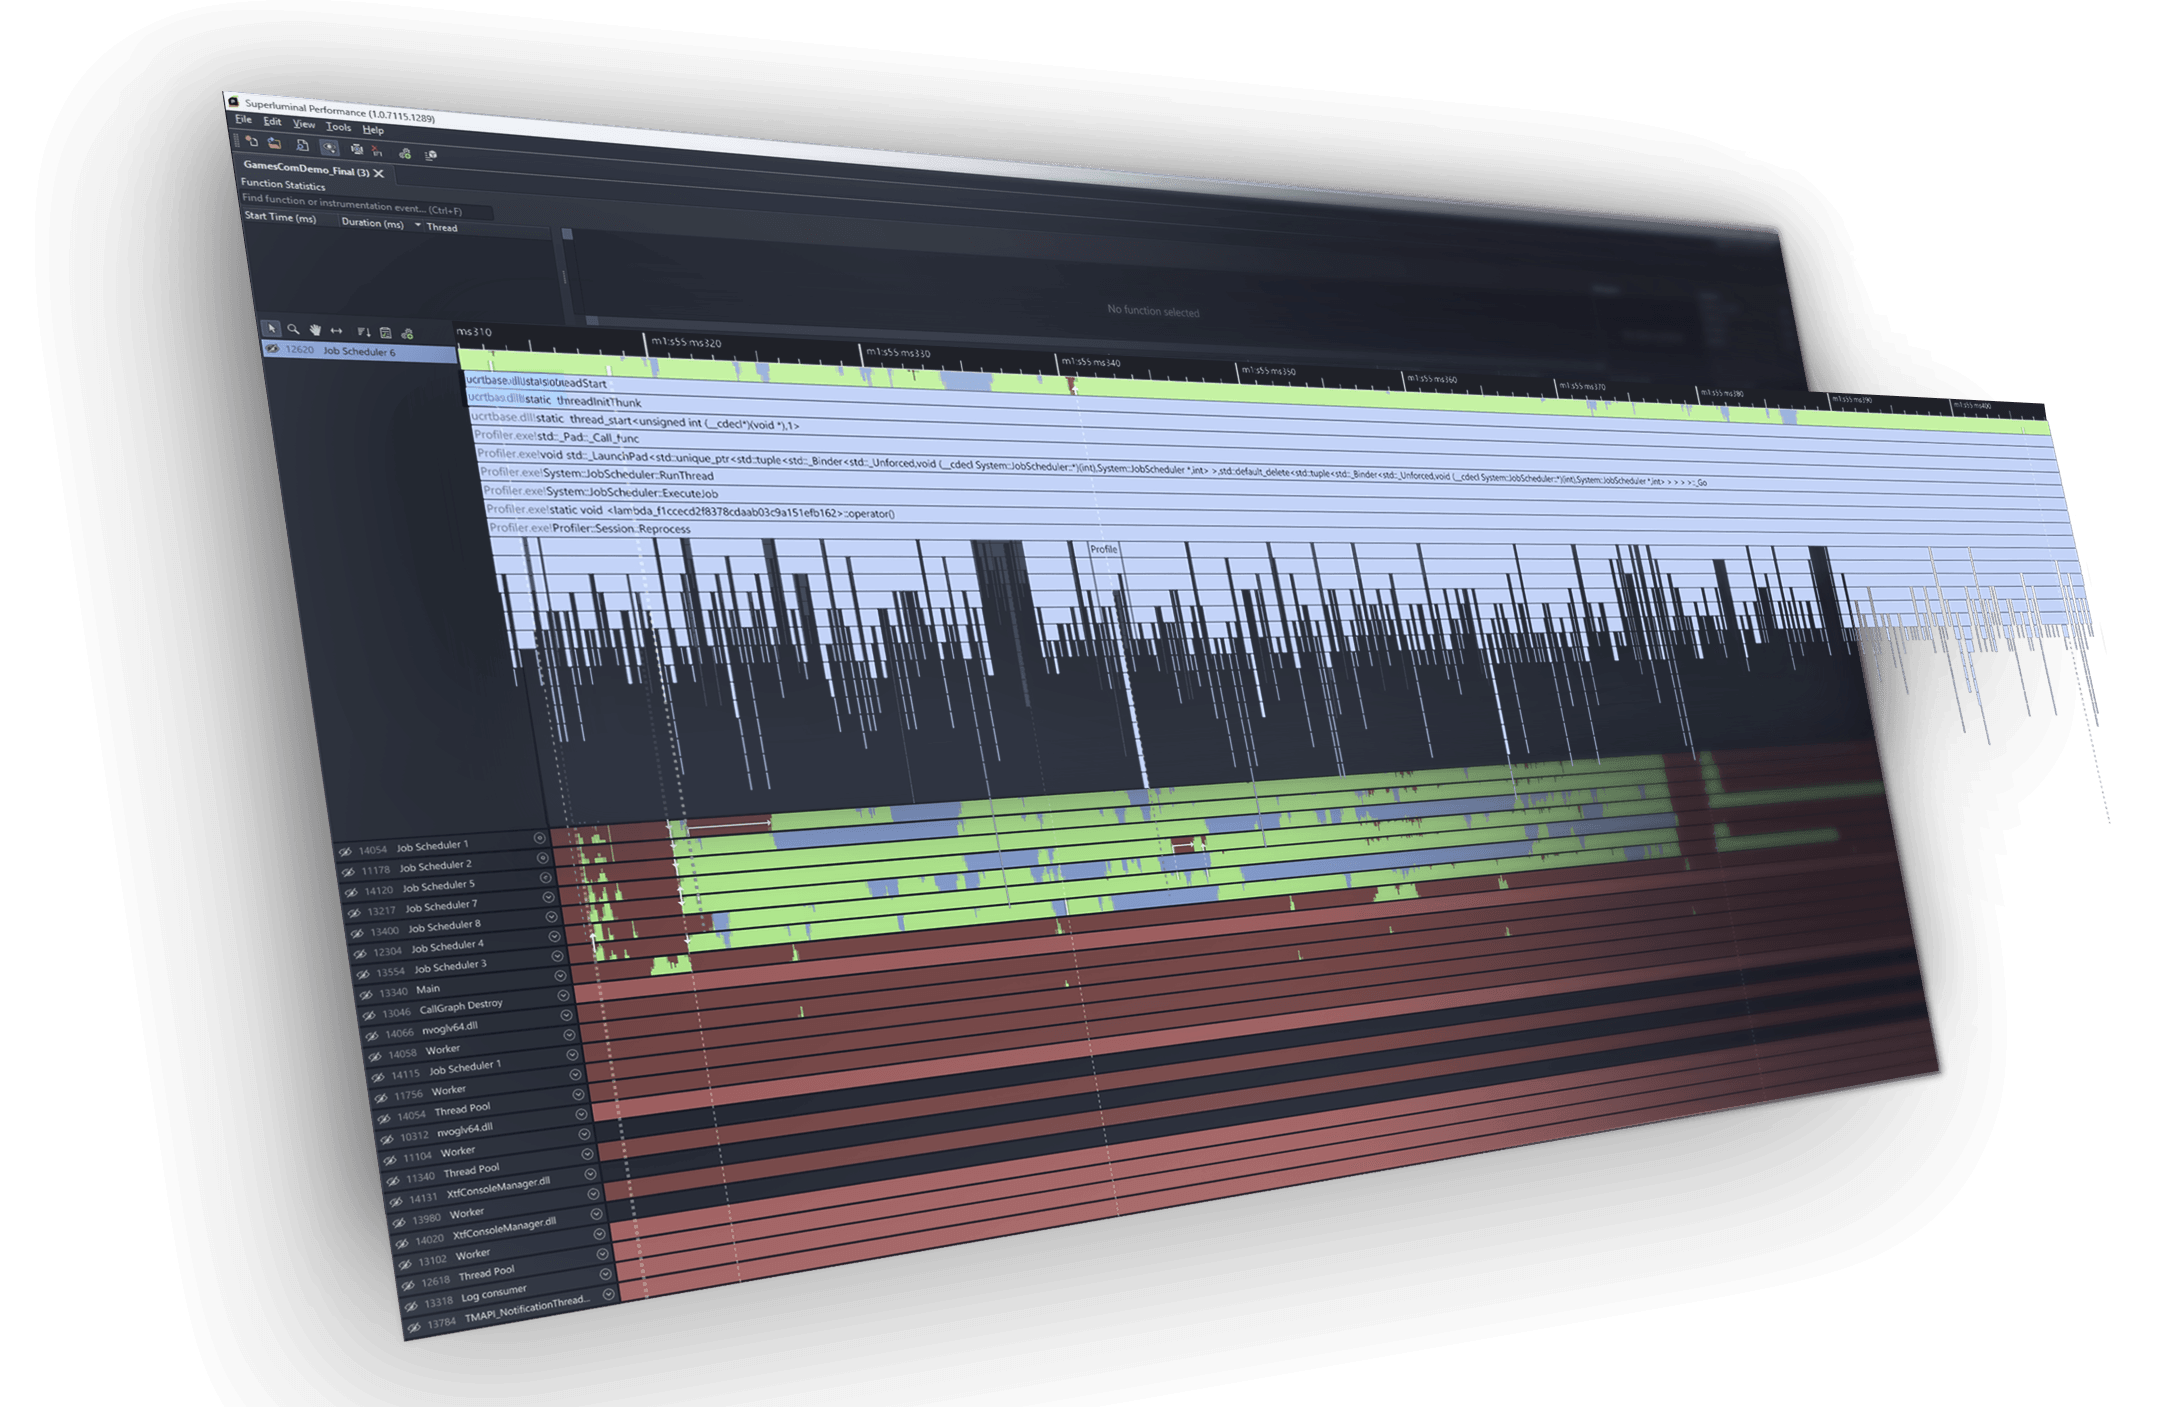
Sampling data is displayed visually on a timeline, giving you an immediate, high‑level overview of how your application behaves.
It allows you to see exactly, per thread, what function is being called when, what functions are being called around it and in what order.
This gives you an unprecedented understanding of what’s happening in your program. Understand not just what’s being called, but more importantly, why it’s being called.
Analyse performance from a single, seamless UI.
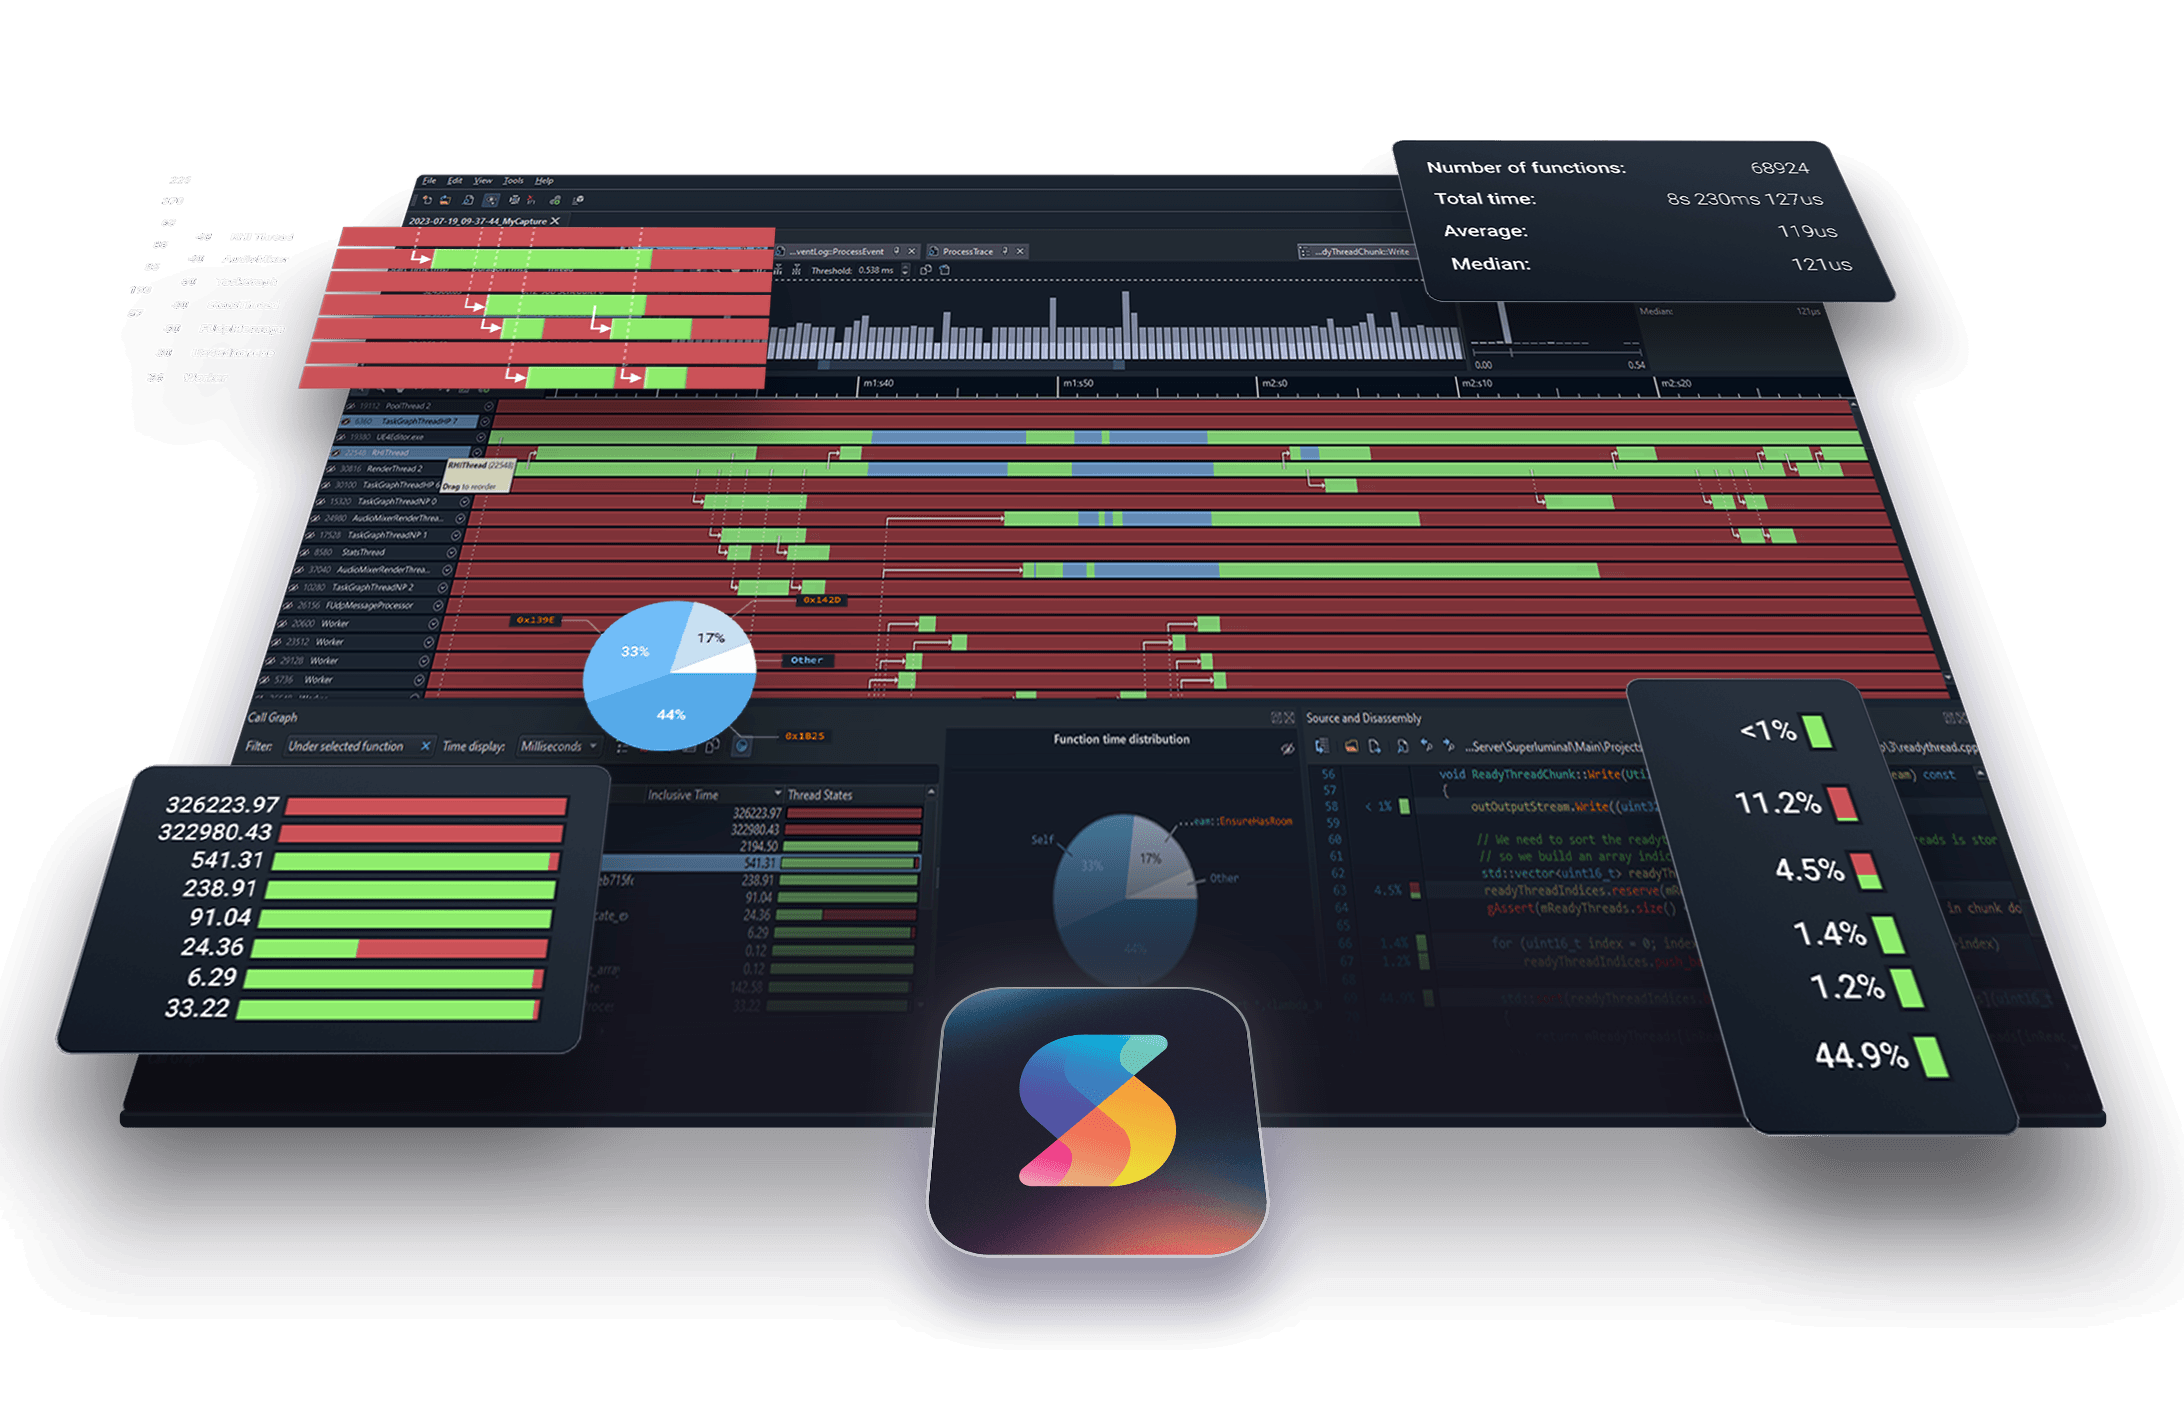
Zoom from a broad, multithread view down to microsecond level detail, follow interactions between threads, and jump straight into source or instruction level views when you’re ready to validate a hypothesis.
All your profiling needs are in one place and every step is designed to answer the next obvious question, helping you move smoothly from “something is slow” to “this is the exact function and line causing it.”
Finally – a solution that makes multi-threaded analysis easy.
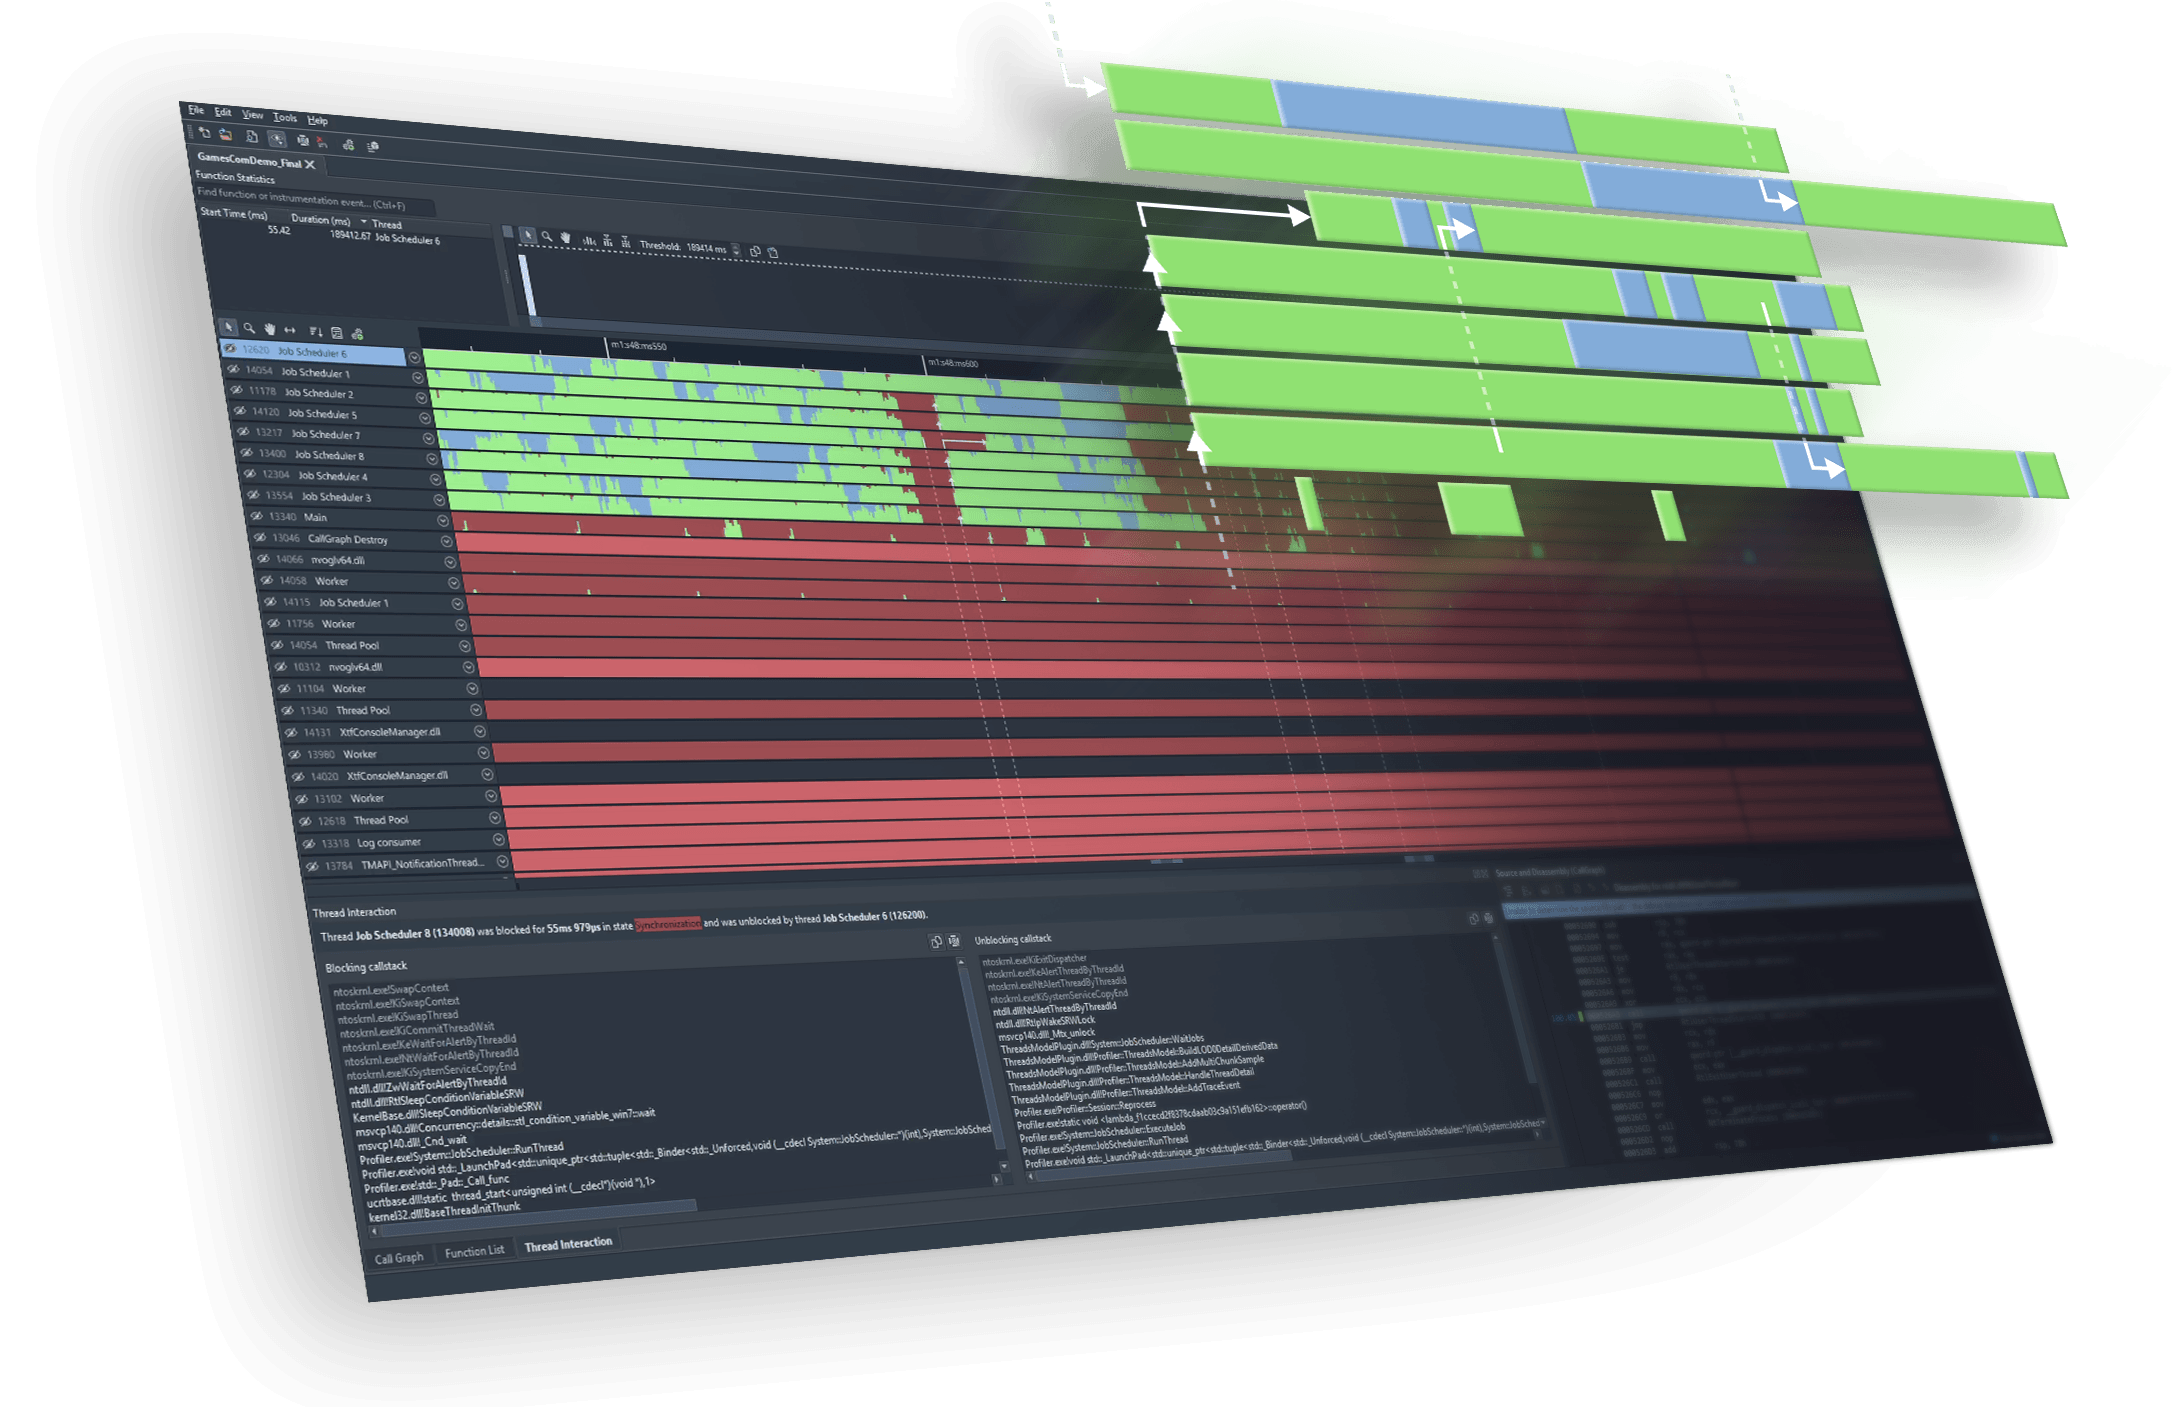
We offer first-class support for the analysis of modern, highly parallel applications. The timeline will show you what state a thread is in at any point in time.
Common causes of multithreading performance issues become obvious at a glance. If your threads are unexpectedly stalling on a lock, fighting over the same lock, or any other threading issue, you’ll spot it in no time at all.
Fantastic UI makes all the difference in finding performance bottlenecks and threading intricacies.
Explore your capture from multiple angles.
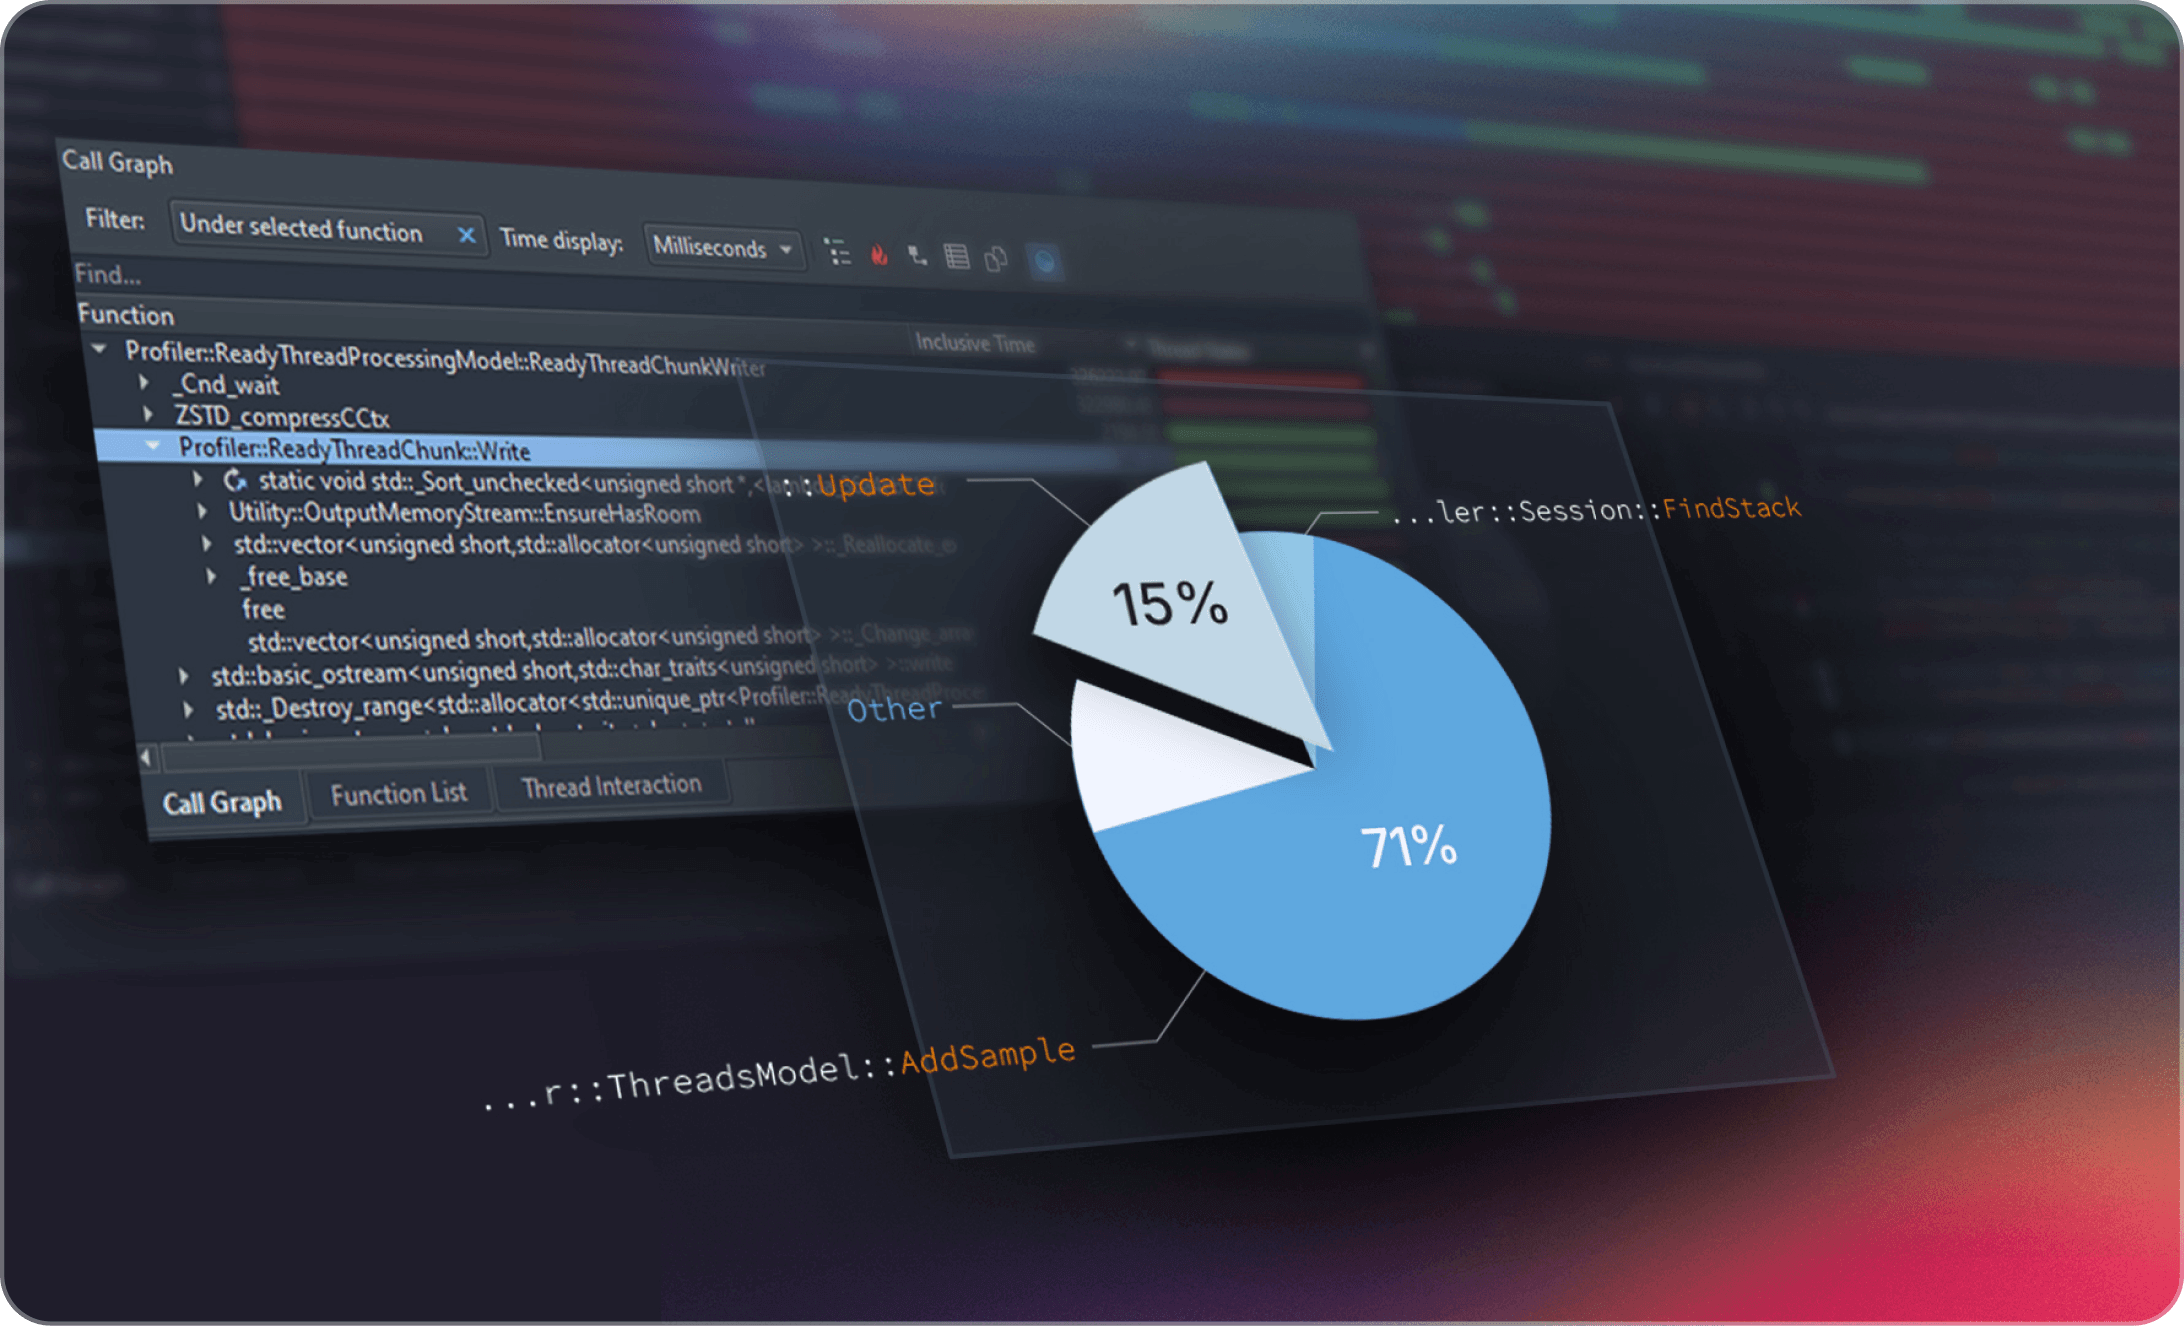
The callgraph view helps you follow the hot path through your code with a clear hierarchical breakdown and a pie chart that instantly shows where time is being spent among child functions. For bottom up analysis, the function list highlights which functions are consuming the most time regardless of where they’re called. And the butterfly view lets you see who is calling into a function and which call paths are the most expensive. All synced to your active time filter so every view stays focused on the exact slice of execution you care about.
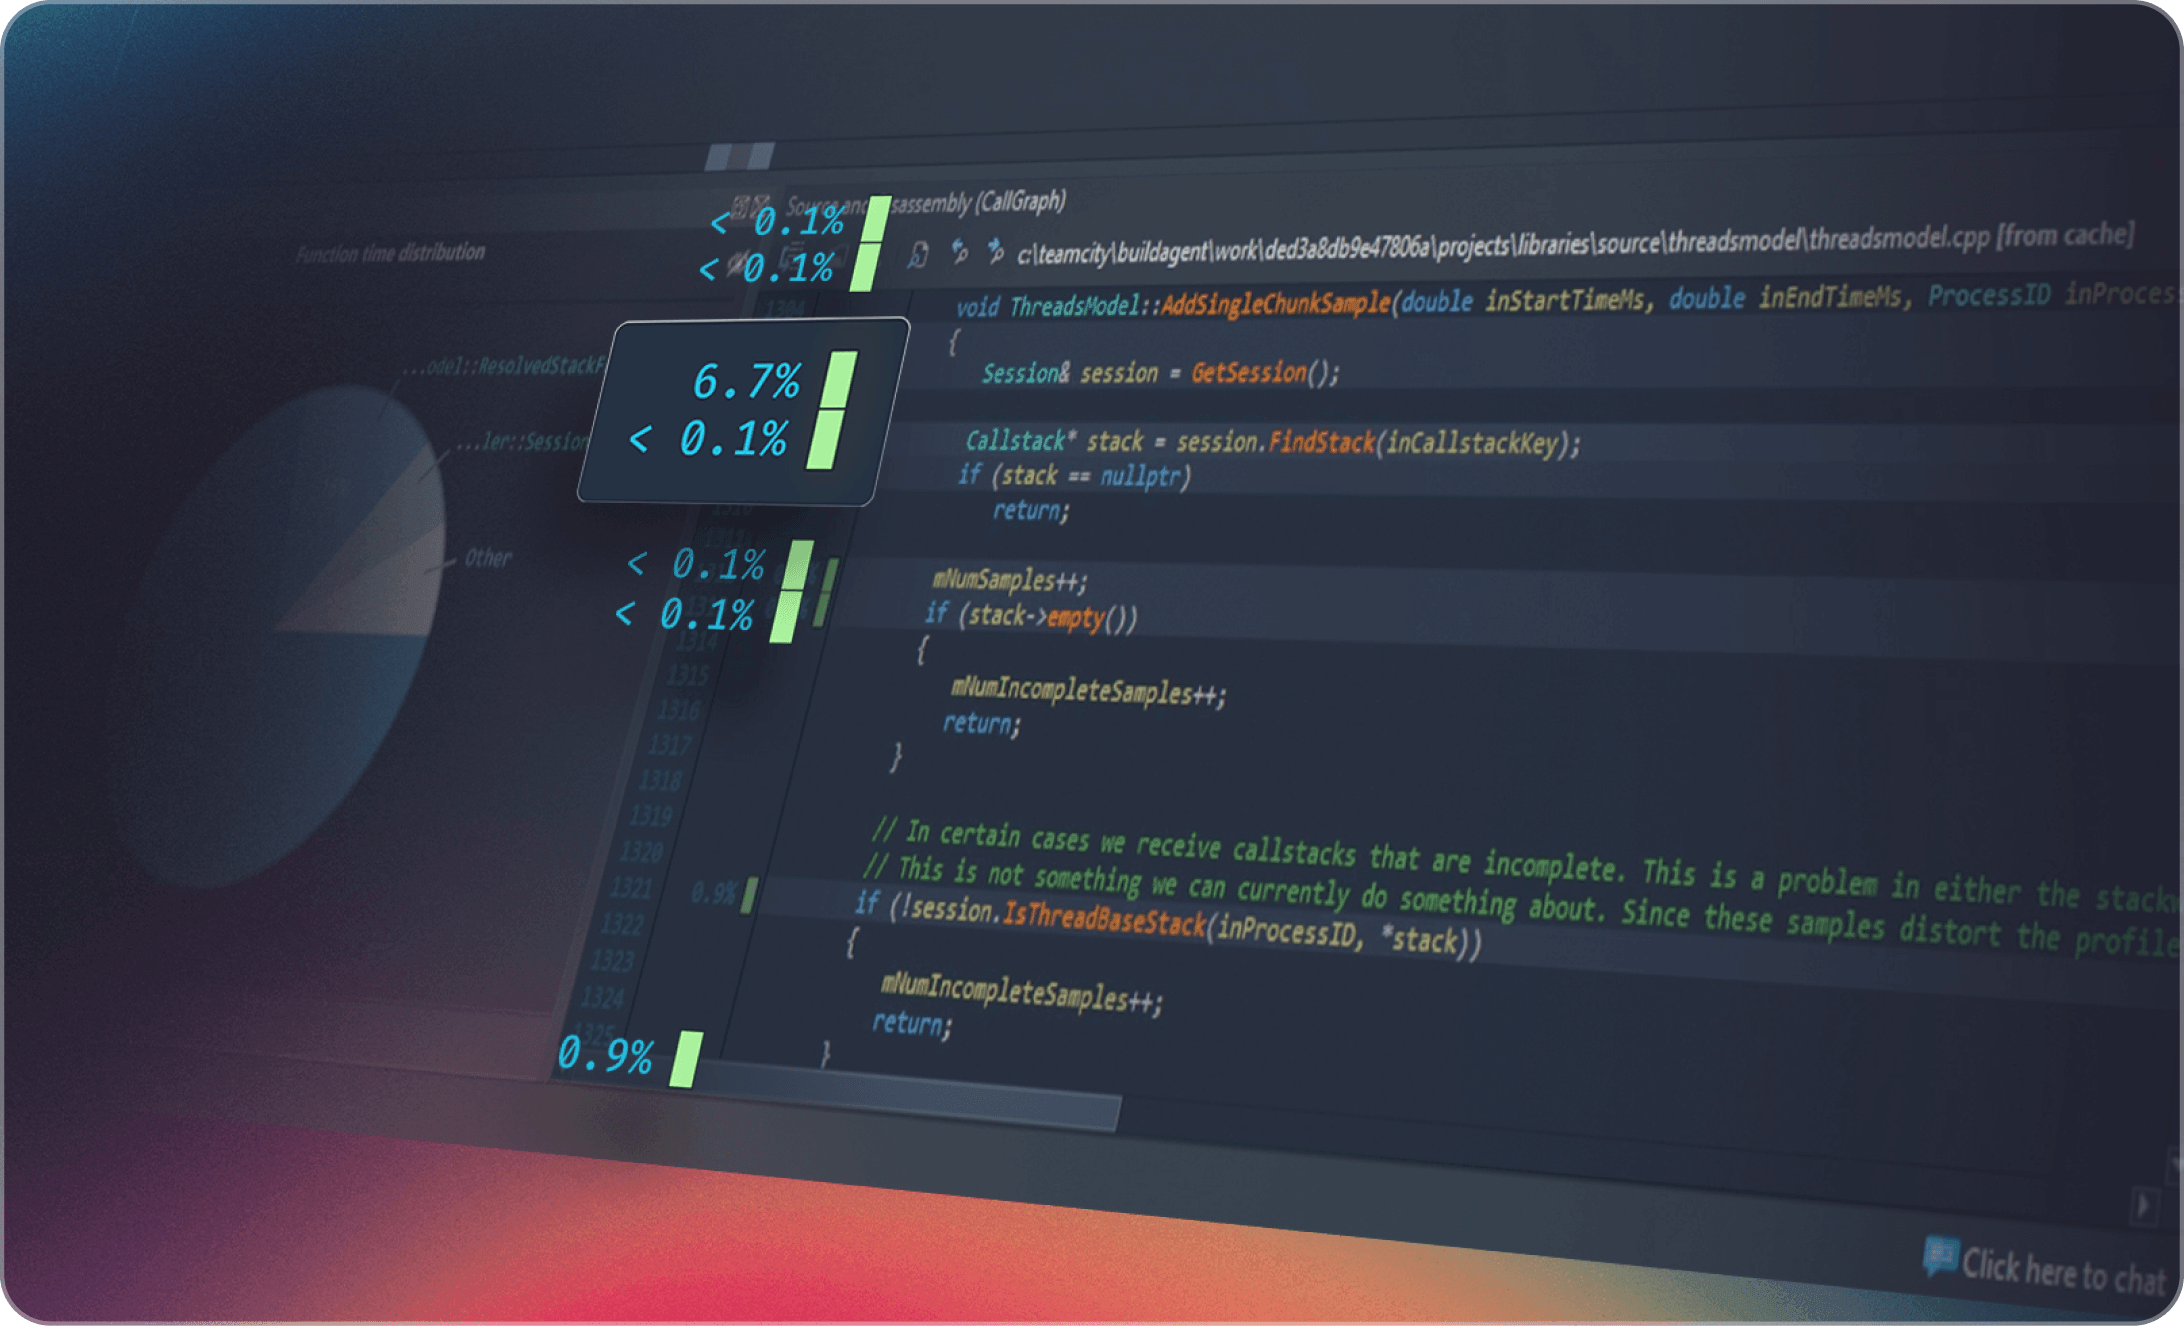
Dive into the details; source & disassembly.
The source window displays source code along with per line timing and thread state information. To drill down even deeper, a mixed-mode disassembly view lets you view per-instruction timing information. If no source code is available, the disassembly is displayed.
Multi-platform
One profiler to rule them all
Superluminal works across all major platforms. That means one UI to learn and one workflow for your entire team. No more switching between platform-specific tools. No more relearning interfaces. Just consistent, powerful performance analysis wherever your code runs.


And that’s not all
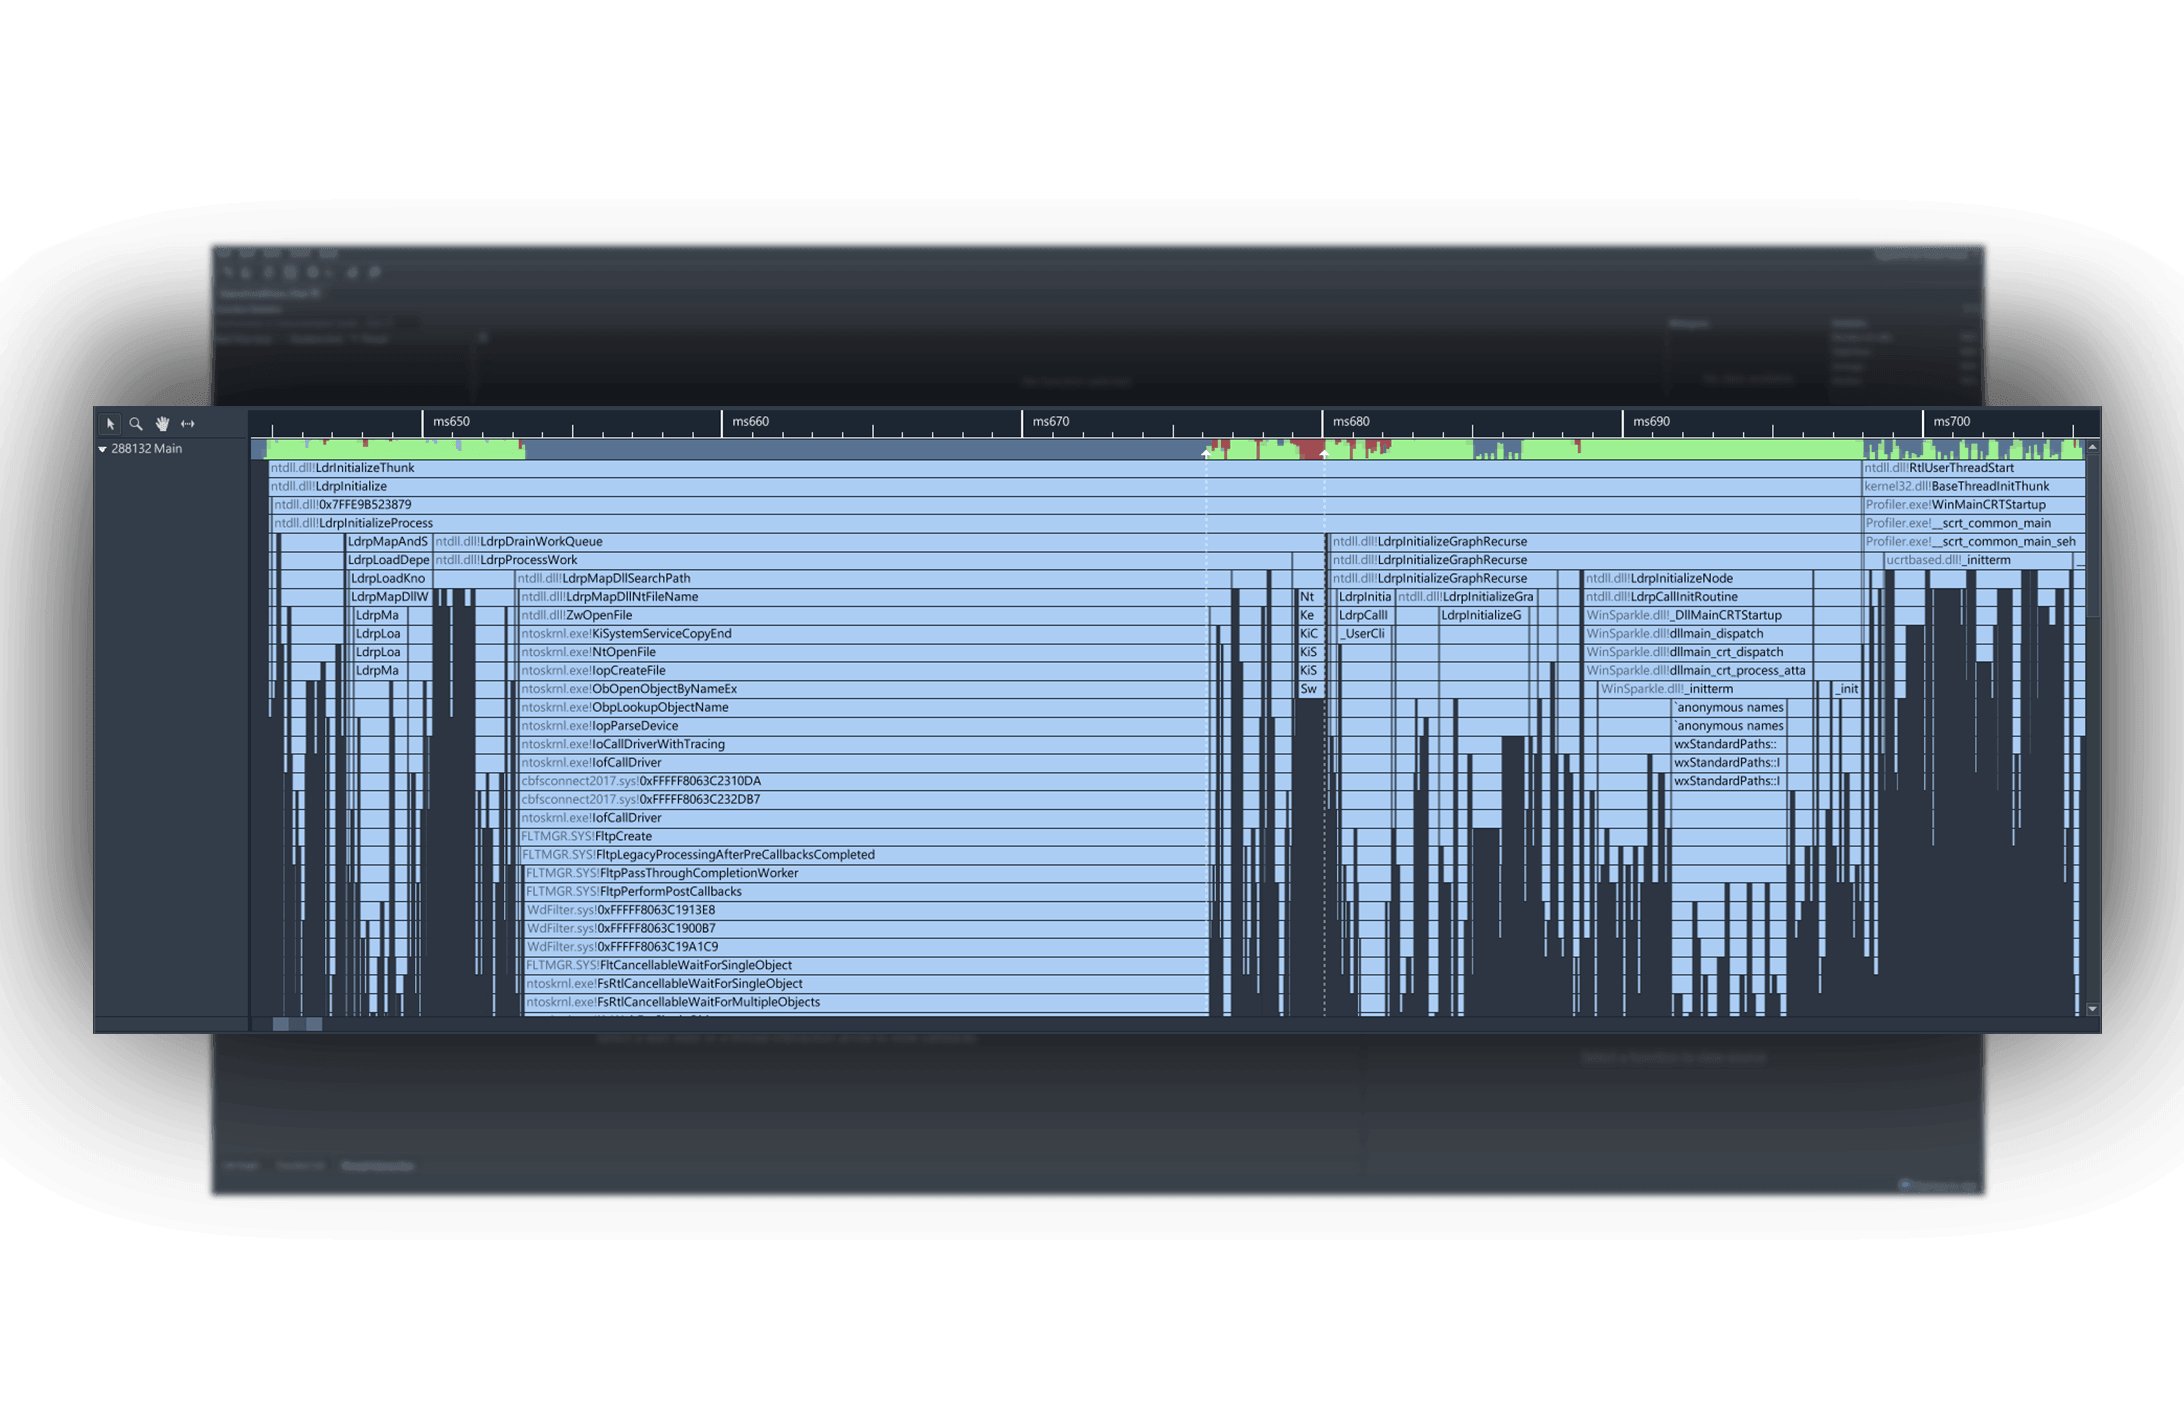
Did someone call for kernel level captures?
Superluminal captures callstacks right down to the kernel level, allowing you to see exactly how the system calls you’re making traverse through the kernel.
You’ll be amazed to see how a seemingly innocent system call will cause havoc, causing the kernel to page data in and out or locks system-wide mutexes. See exactly what happens at program startup and how DLLs are loaded and initialized.
Instrumentation API gives you the best of both worlds.
While Superluminal is a sampling profiler, sometimes you need just a little bit more context. For those cases, an Instrumentation API is included that can be used to selectively mark up your code if needed. Instrumentation data is merged with the sampling data, giving you a single view across both sampling & instrumentation.
Built by devs, for devs

14 day free trial
All features included, no strings attached.
Stop fighting with your CPU profiler and start fixing performance.